
MACD — Moving Average Convergence Divergence: A Complete Guide for Indian Stock Market Traders
What is MACD?
MACD (Moving Average Convergence Divergence) is a trend-following momentum indicator created by Gerald Appel in the late 1970s. It shows the relationship between two exponential moving averages (EMAs) of a security’s price and is one of the most popular indicators among traders on NSE and BSE.
MACD is unique because it combines both trend identification and momentum measurement in a single indicator — making it extremely versatile for Indian traders across all market segments.
MACD Components
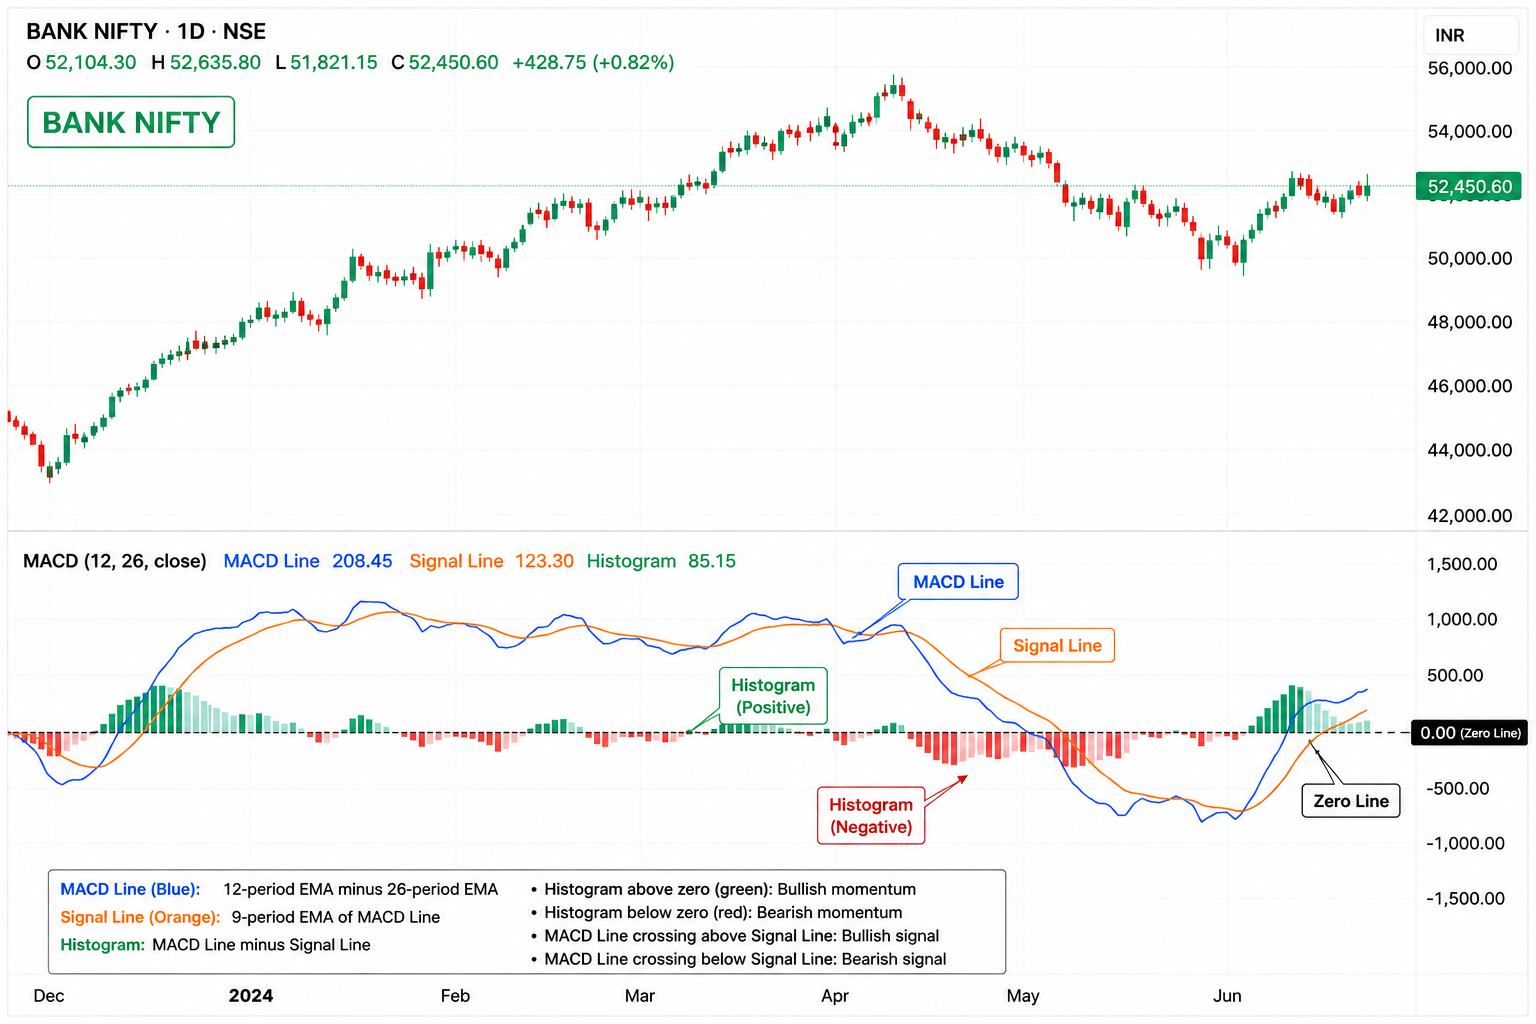
| MACD Line | 12-period EMA minus 26-period EMA |
| Signal Line | 9-period EMA of the MACD Line |
| Histogram | MACD Line minus Signal Line (shown as bars) |
| Zero Line | Reference level — MACD above = bullish, below = bearish |
How to Read MACD
1. MACD Crossovers (Most Common Signal)
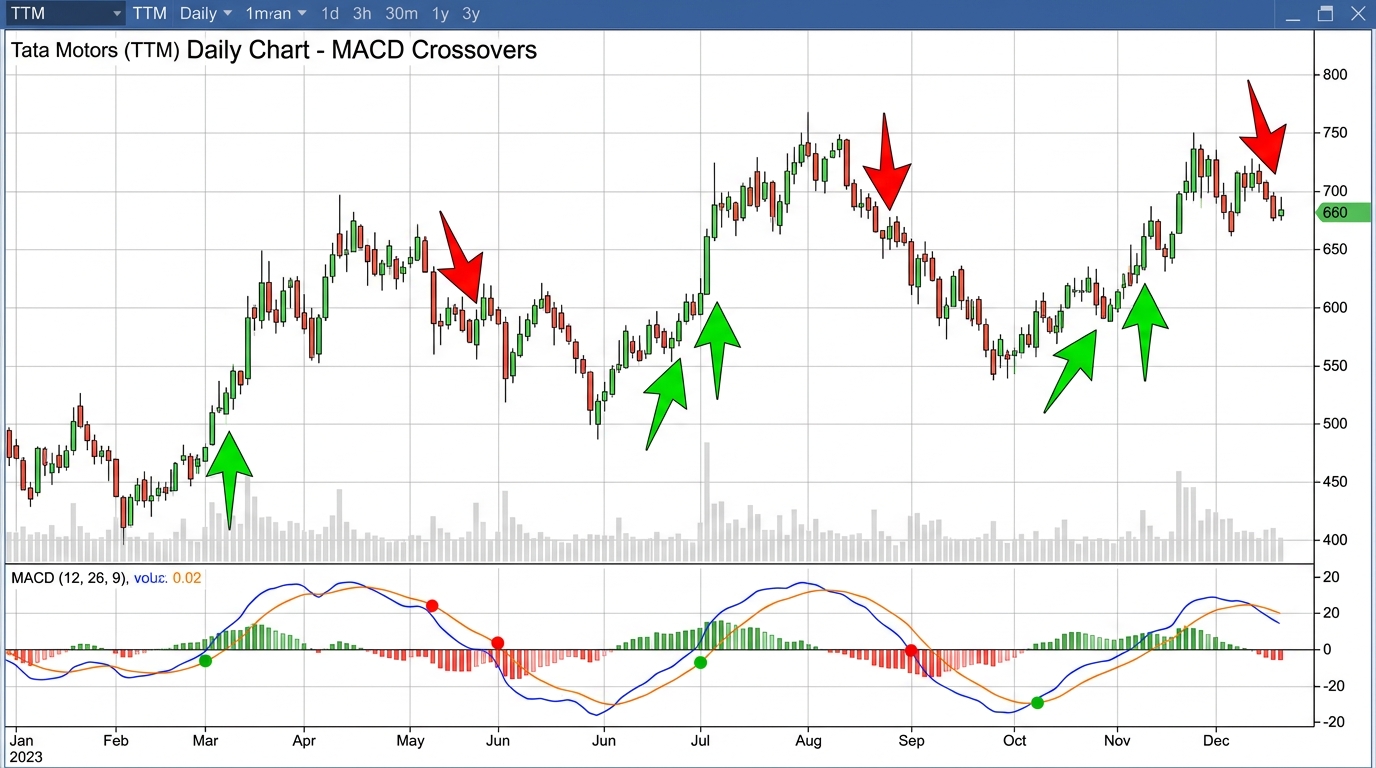
A crossover occurs when the MACD Line crosses above or below the Signal Line. These are the most widely watched MACD signals in Indian trading communities.
- Bullish Crossover: MACD Line crosses above Signal Line — potential buy signal. More reliable when it happens below the zero line.
- Bearish Crossover: MACD Line crosses below Signal Line — potential sell signal. More reliable when it happens above the zero line.
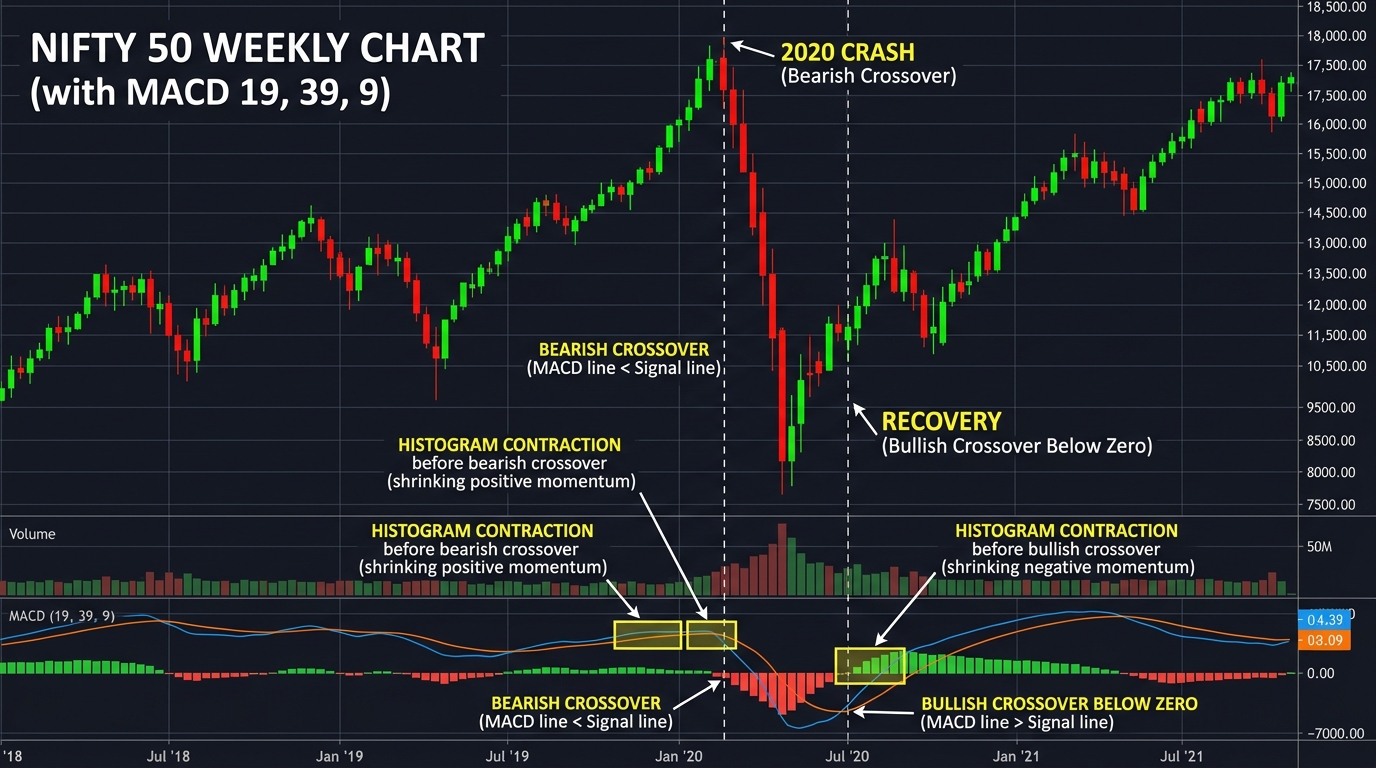
2. Zero Line Crossover
When the MACD Line crosses above zero, it means the 12-EMA has crossed above the 26-EMA — a classic bullish trend confirmation. Below zero signals bearish momentum.
| India Insight: Zero line crossovers on the weekly chart of Nifty 50 have been reliable signals for the beginning and end of major bull and bear phases in Indian markets. |
3. MACD Divergence
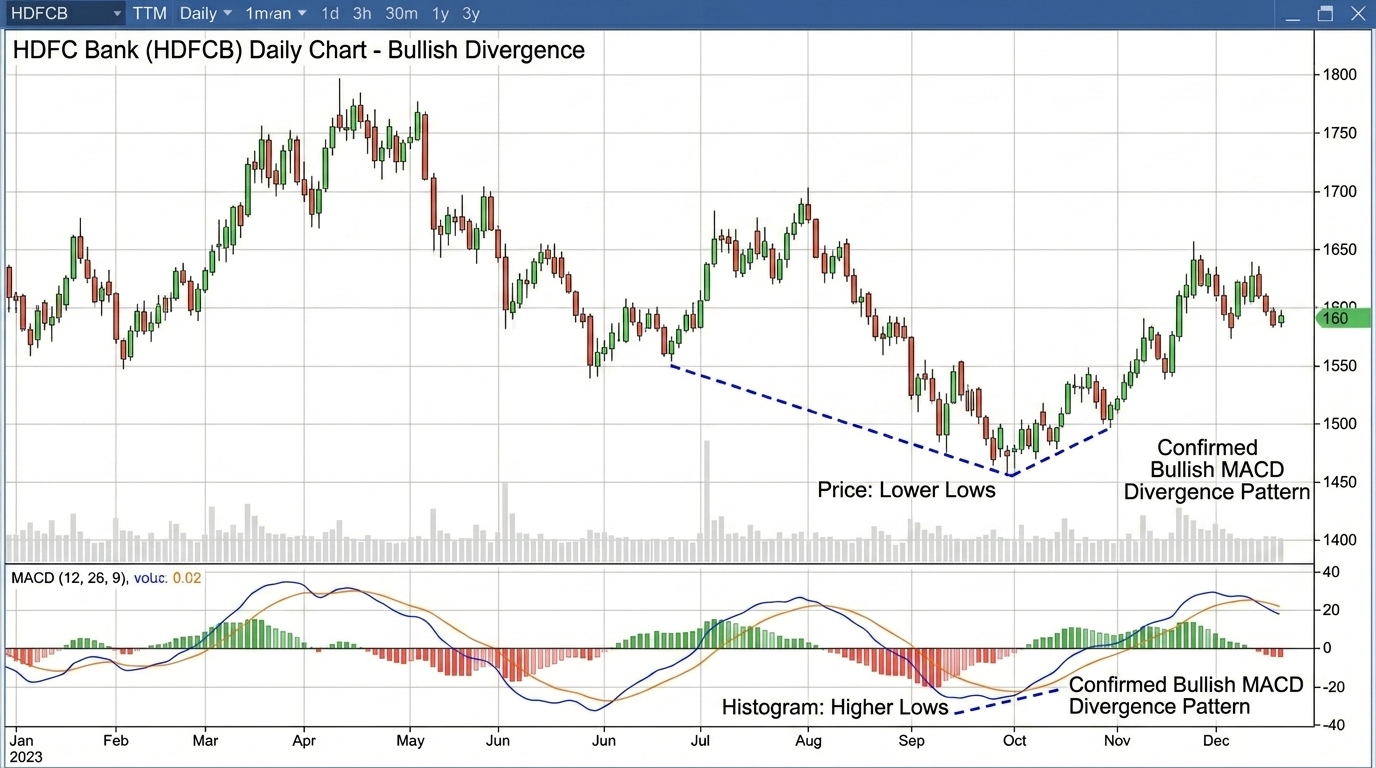
Similar to RSI, MACD divergence with price can signal reversals.
- Bullish Divergence: Price makes lower lows but MACD histogram makes higher lows — often seen before recovery rallies in beaten-down midcap stocks.
- Bearish Divergence: Price makes higher highs but MACD makes lower highs — a warning sign common before corrections in overextended large caps.

4. Histogram Analysis
The histogram shows the distance between MACD and Signal Line. Growing histogram bars indicate accelerating momentum. Shrinking bars warn of slowing momentum — often the first sign before a crossover.
Pro Tip: On Zerodha Kite, change the MACD histogram color scheme to show green bars for rising momentum and red for falling. Watching bars shrink is often an early exit signal. MACD Settings for Indian Markets
Default (12, 26, 9) Best for daily swing trading — NSE large-caps Fast (8, 17, 9) Intraday trading — Bank Nifty options, F&O Slow (19, 39, 9) Weekly charts — positional and long-term traders (5, 35, 5) Appel’s own alternative — smoother signals MACD Strategies for Indian Traders
Strategy 1: MACD + RSI Combo
Wait for a bullish MACD crossover below zero AND RSI crossing above 40. This combination significantly reduces false signals in Nifty midcap and smallcap stocks.
Strategy 2: MACD with Earnings Season
India’s quarterly results season (April, July, October, January) creates sharp MACD signals. A bullish MACD crossover on a stock just before strong quarterly results can be a powerful setup, while a bearish crossover post-result in a weak sector is a strong shorting cue.
Strategy 3: Weekly MACD for FII/DII Flows
Institutional flow from Foreign Institutional Investors (FIIs) and Domestic Institutional Investors (DIIs) drives major trends in Indian markets. A bullish MACD crossover on the Nifty weekly chart when FII data shows net buying is a high-conviction entry.
Common Mistakes to Avoid
- Acting on every MACD crossover in a ranging, sideways market — MACD is a trend indicator and gives many false signals in choppy conditions.
- Ignoring the histogram — many traders only watch crossovers but miss the early warning signs in histogram momentum.
- Using MACD alone on F&O (Futures & Options) expiry days — extreme volatility can produce misleading signals.
Summary
Key Takeaway: MACD works best in trending markets. Use crossovers for entry/exit signals, divergences for reversal setups, and the histogram for momentum confirmation. Combine with price action and volume for best results on NSE/BSE.
Responses