
Bollinger Bands: A Complete Guide for Indian Stock Market Traders
What are Bollinger Bands?
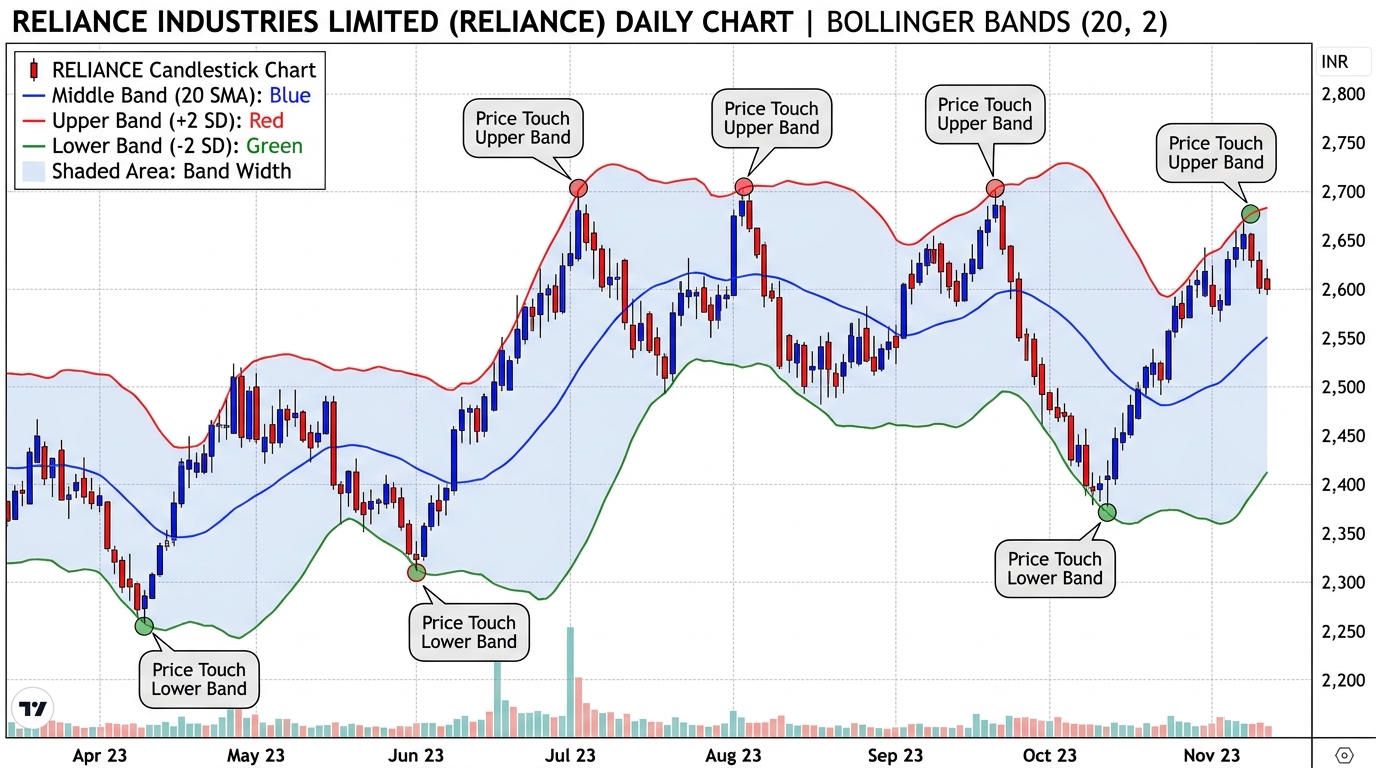
Bollinger Bands, developed by John Bollinger in the 1980s, are a volatility indicator that consists of three lines plotted around a price chart. They adapt dynamically to market conditions — widening when volatility increases and contracting when it decreases.
For Indian traders, Bollinger Bands are especially useful for identifying breakouts in Nifty 50, Bank Nifty, and individual stocks, as well as for spotting potential reversals in highly liquid large-cap counters.
The Three Bands Explained
| Middle Band | 20-period Simple Moving Average (SMA) of closing prices |
| Upper Band | Middle Band + (2 x Standard Deviation) |
| Lower Band | Middle Band – (2 x Standard Deviation) |
| Band Width | Distance between upper and lower bands — measures volatility |
Statistically, approximately 95% of price action falls within the upper and lower bands. When price consistently touches or breaks outside a band, it signals an unusual market condition.
Key Concepts
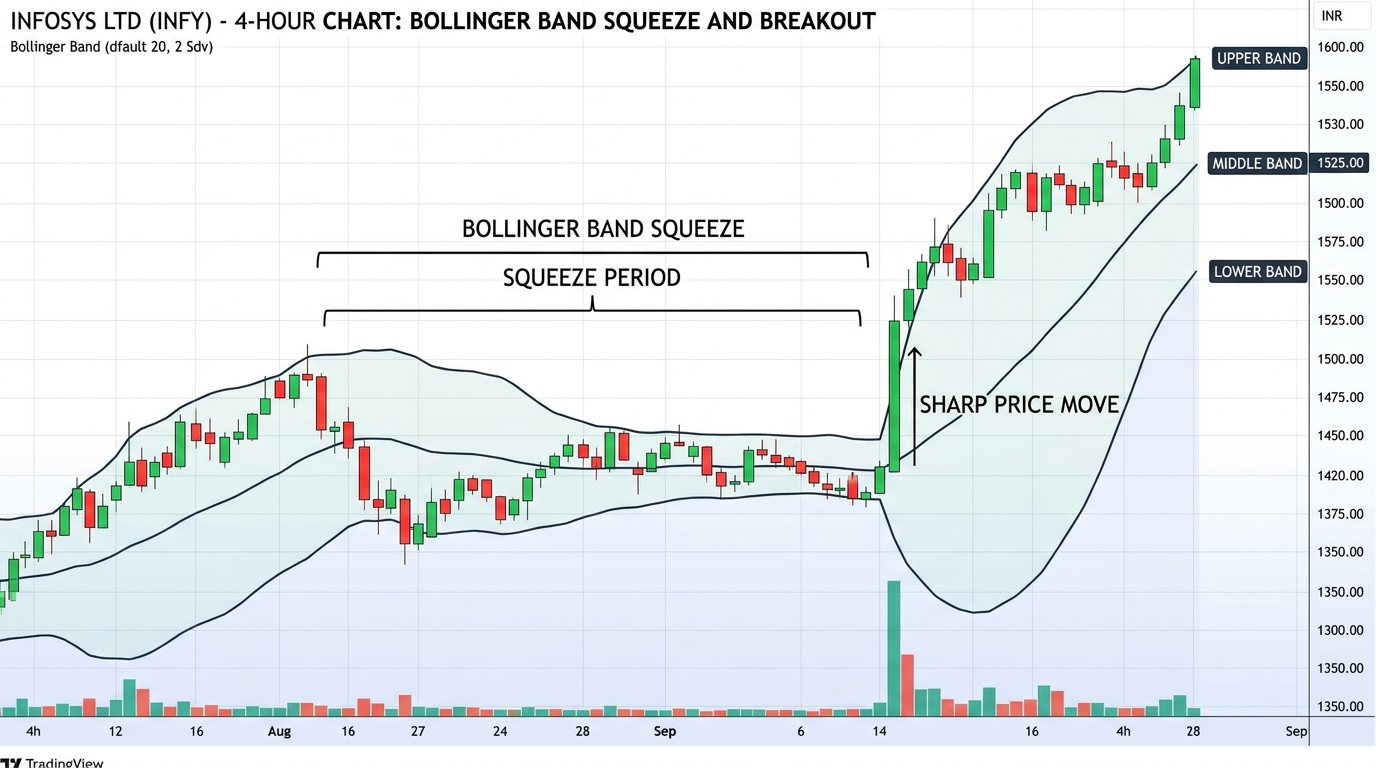
1. Bollinger Band Squeeze
A squeeze occurs when the bands narrow significantly — indicating low volatility. This is one of the most important setups in Indian markets because it often precedes a sharp breakout, especially ahead of major events like RBI policy meetings, budget announcements, or quarterly earnings.
- Narrow bands = compressed volatility = potential explosive move coming
- Direction of breakout is not predicted by the squeeze — combine with volume and other indicators
2. Band Walk (Riding the Trend)
In a strong trend, price can ‘walk the band’ — repeatedly touching or closing outside one band. This is common in momentum stocks on the NSE smallcap index.
- Walking the upper band = sustained bullish momentum (not an automatic sell signal)
- Walking the lower band = sustained bearish momentum (not an automatic buy signal)
| India Context: During F&O-driven rallies in Bank Nifty, the index can walk the upper band for several sessions. Don’t short just because price is at the upper band — look for a close back inside the band first. |
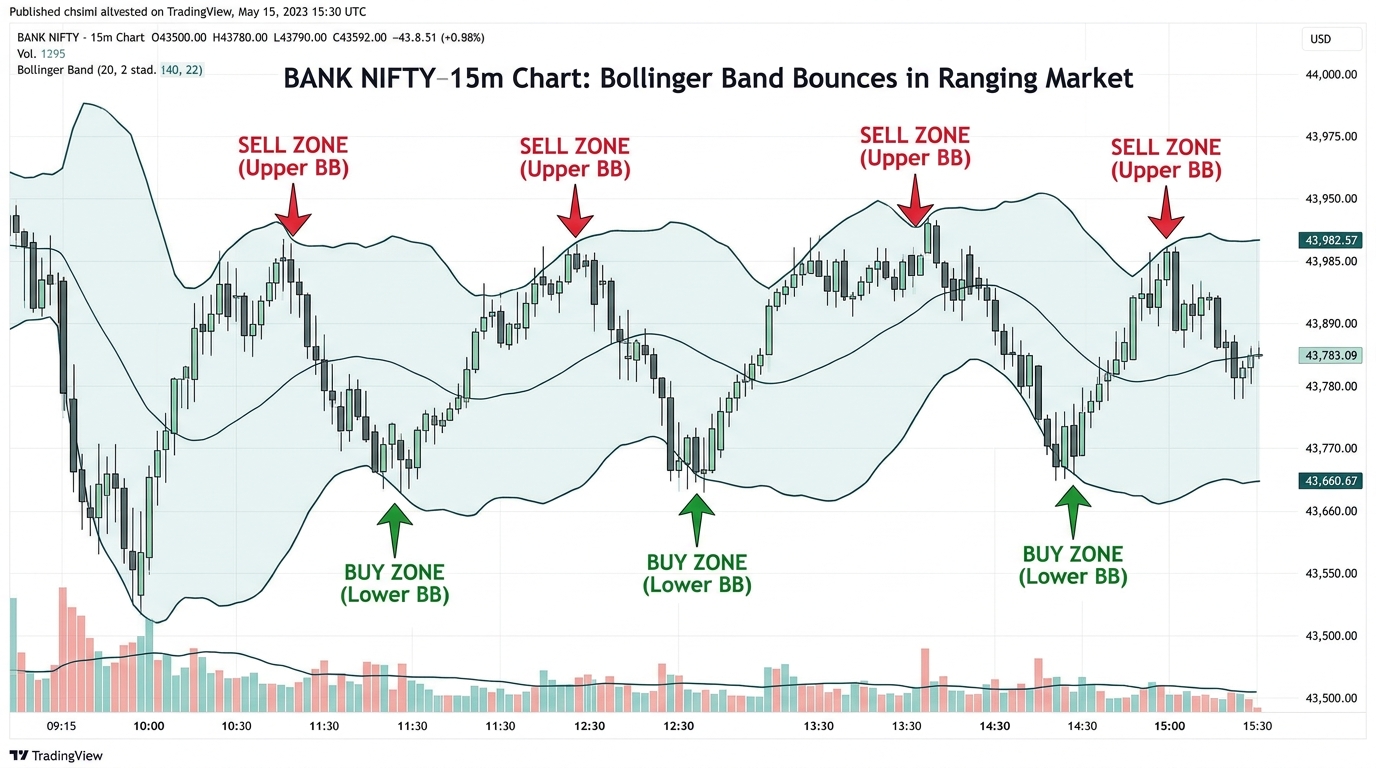
3. Bollinger Bounce
In a ranging (sideways) market, price tends to bounce between the upper and lower bands, with the middle band acting as a mean reversion point. This is a classic setup for range-bound traders.
- Price touching lower band in a range = potential bounce target back to middle band
- Price touching upper band in a range = potential pullback to middle band
4. Upper & Lower Band as Dynamic Support/Resistance
The middle band (20 SMA) acts as dynamic support in uptrends and dynamic resistance in downtrends. It is a frequently used level for Nifty swing traders to enter on pullbacks.
Bollinger Band Settings
| Standard (20, 2) | Best for daily and weekly charts — most stocks on NSE |
| (10, 1.5) | More sensitive — useful for intraday 5-min charts |
| (50, 2.1) | For long-term positional traders on weekly charts |
| (20, 1) + (20, 2) | Double Bollinger Bands — advanced setup for trend confirmation |
Bollinger Band Strategies for Indian Markets
Strategy 1: Squeeze Breakout with Volume
Identify stocks in a Bollinger Band squeeze (use the Band Width indicator). Wait for a candle that breaks outside the band with above-average volume. Enter in the direction of the breakout. This strategy works especially well in Nifty midcap stocks during earnings season.
Strategy 2: %B Indicator
The %B indicator shows where price is relative to the bands. A %B above 1.0 means price is above the upper band; below 0.0 means below the lower band. Use %B to identify when an extreme reading is fading back toward normal — a reversal signal.
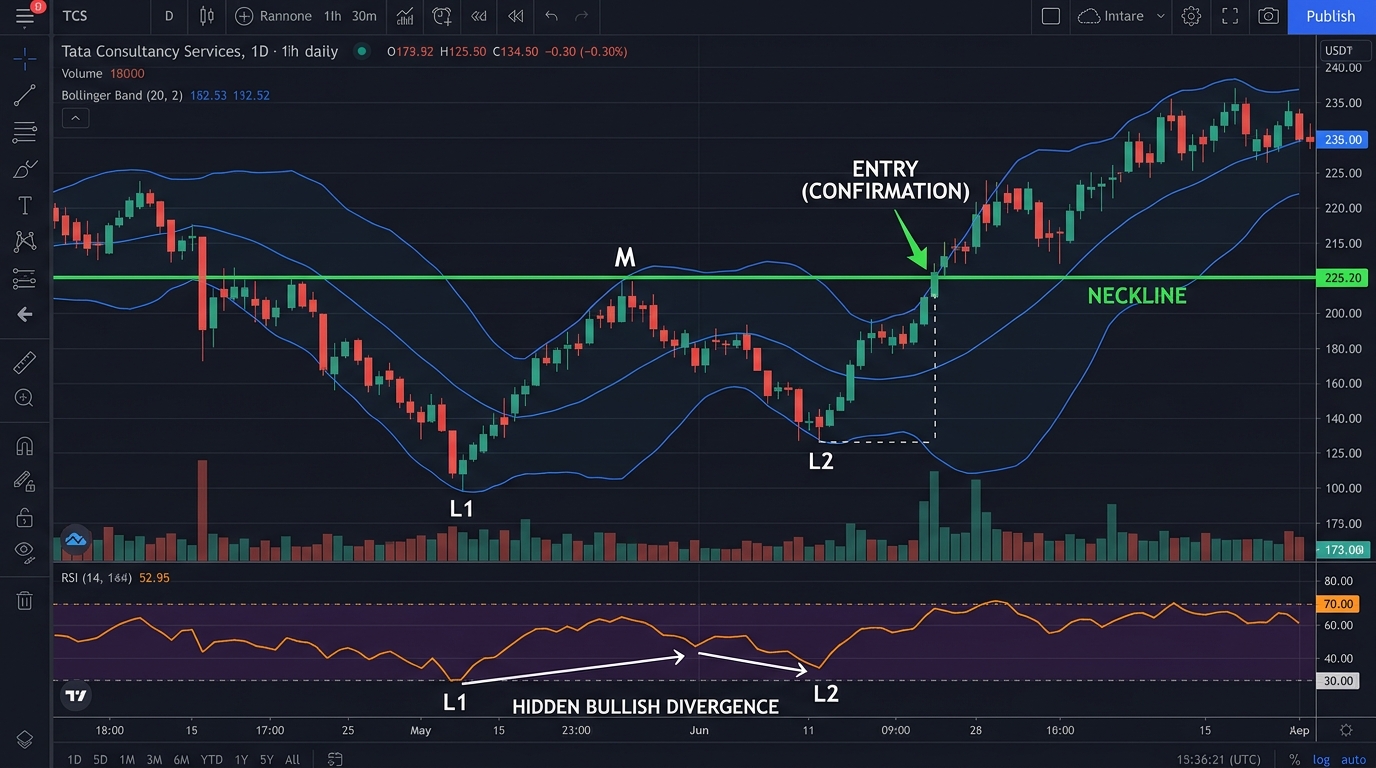
Strategy 3: Double Bottom with Lower Band
If price touches the lower band, pulls back, then retests the lower band but RSI makes a higher low (divergence) — this W-pattern double bottom is a high-probability long setup, commonly seen in quality large-caps during market corrections.
Common Mistakes to Avoid
- Buying just because price touched the lower band — in a downtrend, price can walk the lower band continuously.
- Selling just because price touched the upper band — in a strong trend, this can be an extremely costly mistake.
- Ignoring volume — any Bollinger Band breakout without volume confirmation has a high failure rate.
Summary
| Key Takeaway: Bollinger Bands are a dynamic volatility tool. Use squeezes to anticipate breakouts, band walks to ride trends, and band bounces in ranging markets. Always combine with volume and RSI for high-quality signals on NSE and BSE. |
Responses