
Volume & OBV — On-Balance Volume: A Complete Guide for Indian Stock Market Traders
Why Volume Matters More Than Price
Volume is the total number of shares or contracts traded during a given period. In trading, price tells you what happened, but volume tells you WHY it happened. A price move on high volume is far more significant than the same move on low volume.
For Indian traders, volume analysis is especially critical because FII (Foreign Institutional Investor) and DII (Domestic Institutional Investor) activity shows up in volume data before it becomes obvious in price. Tracking unusual volume spikes in NSE-listed stocks is a key edge many successful Indian traders use.
Basic Volume Principles
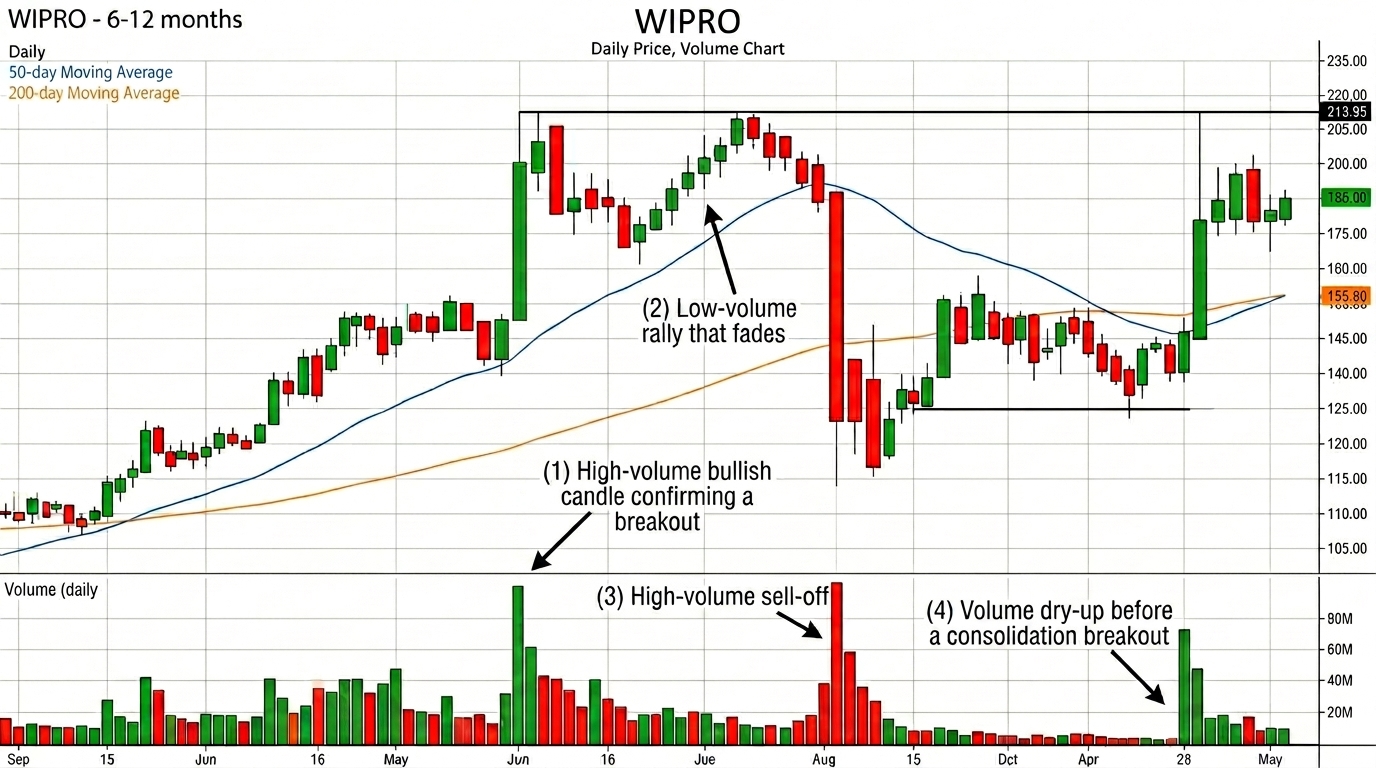
| High volume + Price up | Strong buying interest — bullish confirmation |
| High volume + Price down | Strong selling interest — bearish confirmation |
| Low volume + Price up | Weak rally — suspect, may not sustain |
| Low volume + Price down | Weak correction — may be just profit-booking |
| Volume spike on breakout | High-probability breakout — strong signal |
| Volume dry-up | Low interest — often precedes a sharp move |
What is OBV (On-Balance Volume)?
OBV, developed by Joe Granville in 1963, is a cumulative volume indicator that adds volume on up days and subtracts volume on down days. The theory is that volume precedes price — OBV rising before price rises is an early signal of accumulation (institutional buying).
| Formula: If today’s close > yesterday’s close: OBV = Previous OBV + Today’s Volume. If today’s close < yesterday’s close: OBV = Previous OBV – Today’s Volume. |
Reading OBV
OBV Trend Confirmation
When OBV is rising along with price, it confirms the uptrend — buyers are in control. When OBV falls with price, it confirms the downtrend. When price and OBV move in the same direction, there is no divergence and the trend is healthy.
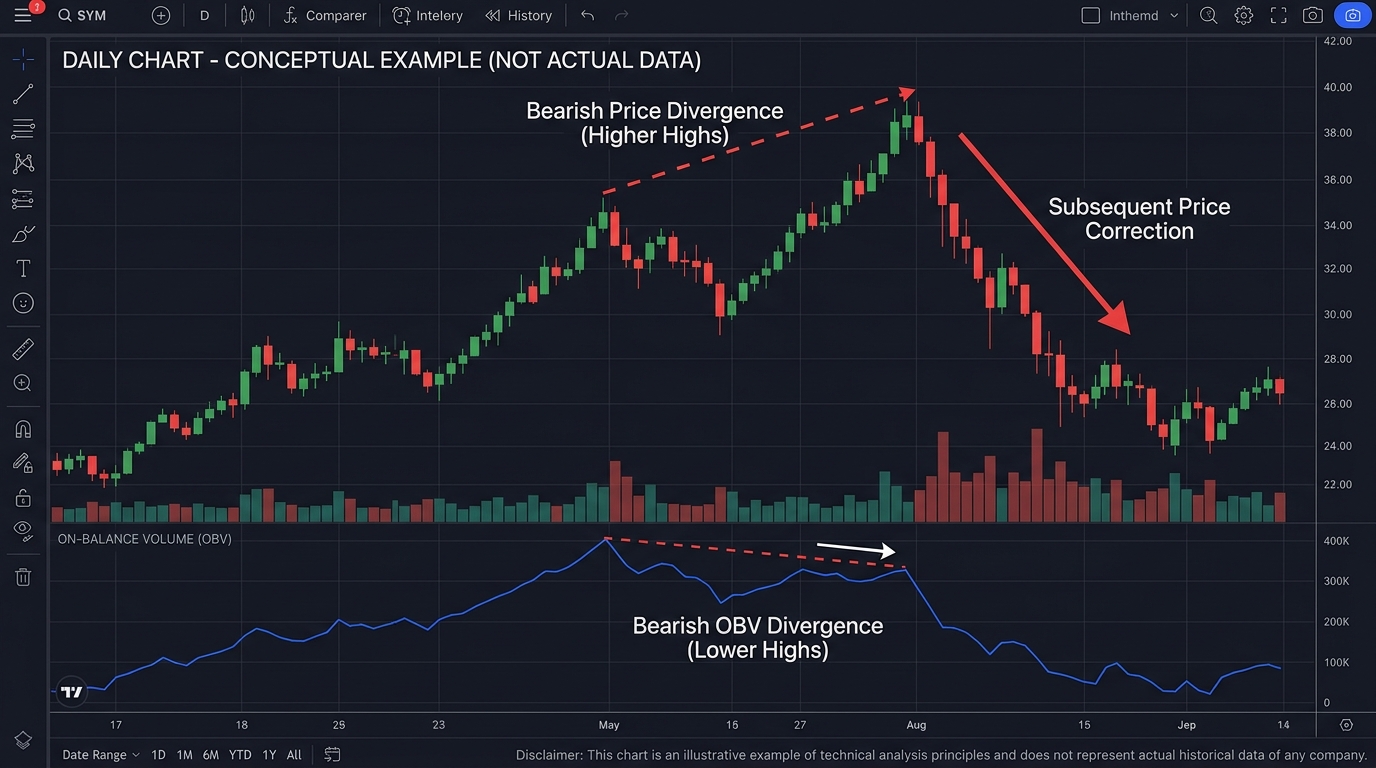
OBV Divergence — The Powerful Signal
OBV divergence is one of the most reliable early warning signals in technical analysis.
- Bullish OBV Divergence: Price makes a lower low but OBV makes a higher low — smart money is quietly accumulating. Often seen in quality stocks before a significant reversal upward.
- Bearish OBV Divergence: Price makes a higher high but OBV makes a lower high — distribution is happening. Institutions are selling into the retail buying rally.
Volume Price Analysis (VPA)
VPA is the practice of reading price and volume together, candle by candle. Key patterns to watch for in Indian markets:
- Buying Climax: Very high volume on a large up-candle after a prolonged rally — often marks a major top (seen in midcap stocks during bull market peaks)
- Selling Climax: Very high volume on a large down-candle after a prolonged decline — often marks a major bottom (seen in Nifty during COVID crash March 2020)
- No Demand Bar: Narrow range up-candle on very low volume — bulls have no conviction; watch for reversal
- No Supply Bar: Narrow range down-candle on very low volume — bears have no conviction; watch for upside
Volume Strategies for Indian Markets
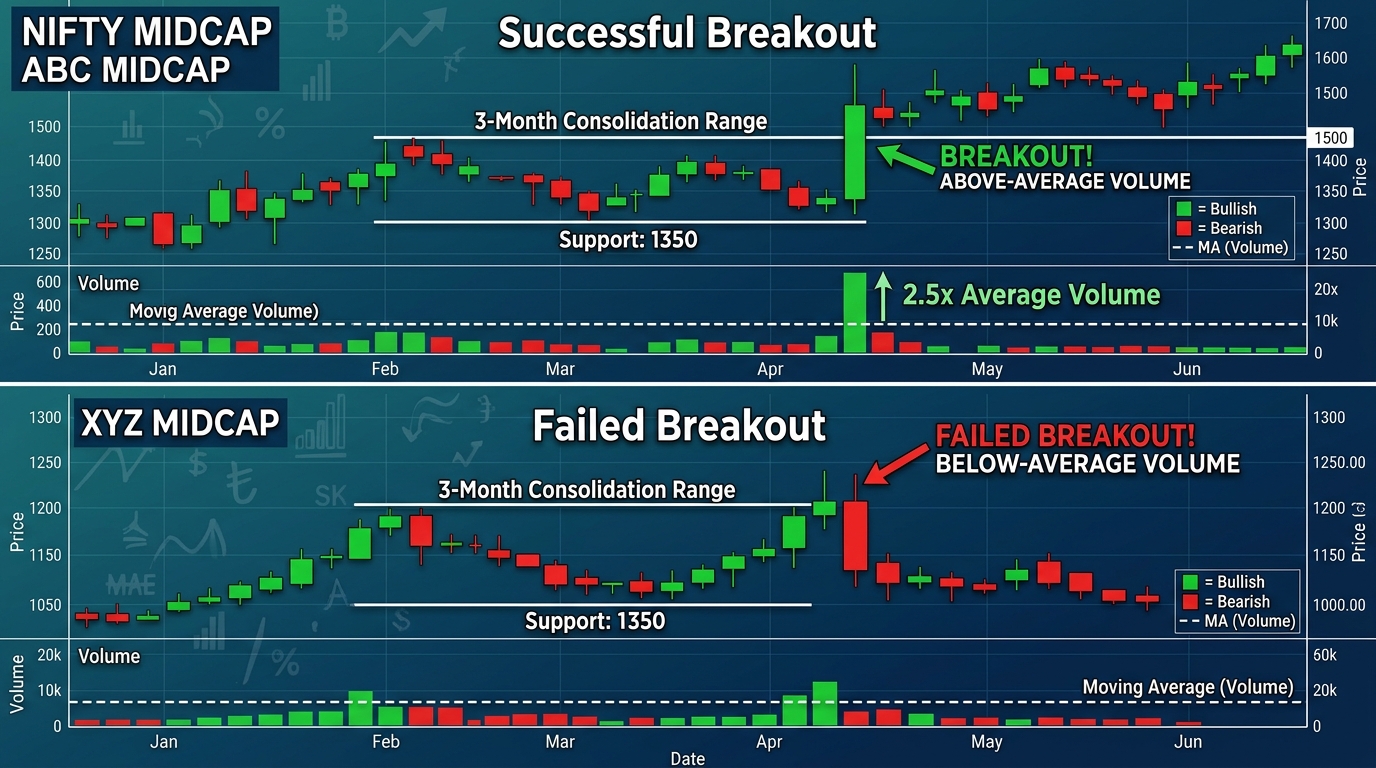
Strategy 1: Breakout Confirmation with Volume
For any breakout from a consolidation zone, resistance level, or chart pattern (cup & handle, flag, triangle), always confirm with volume. In Indian markets, a genuine breakout typically shows 150-300% of average daily volume. Without volume, the breakout has a high failure rate.
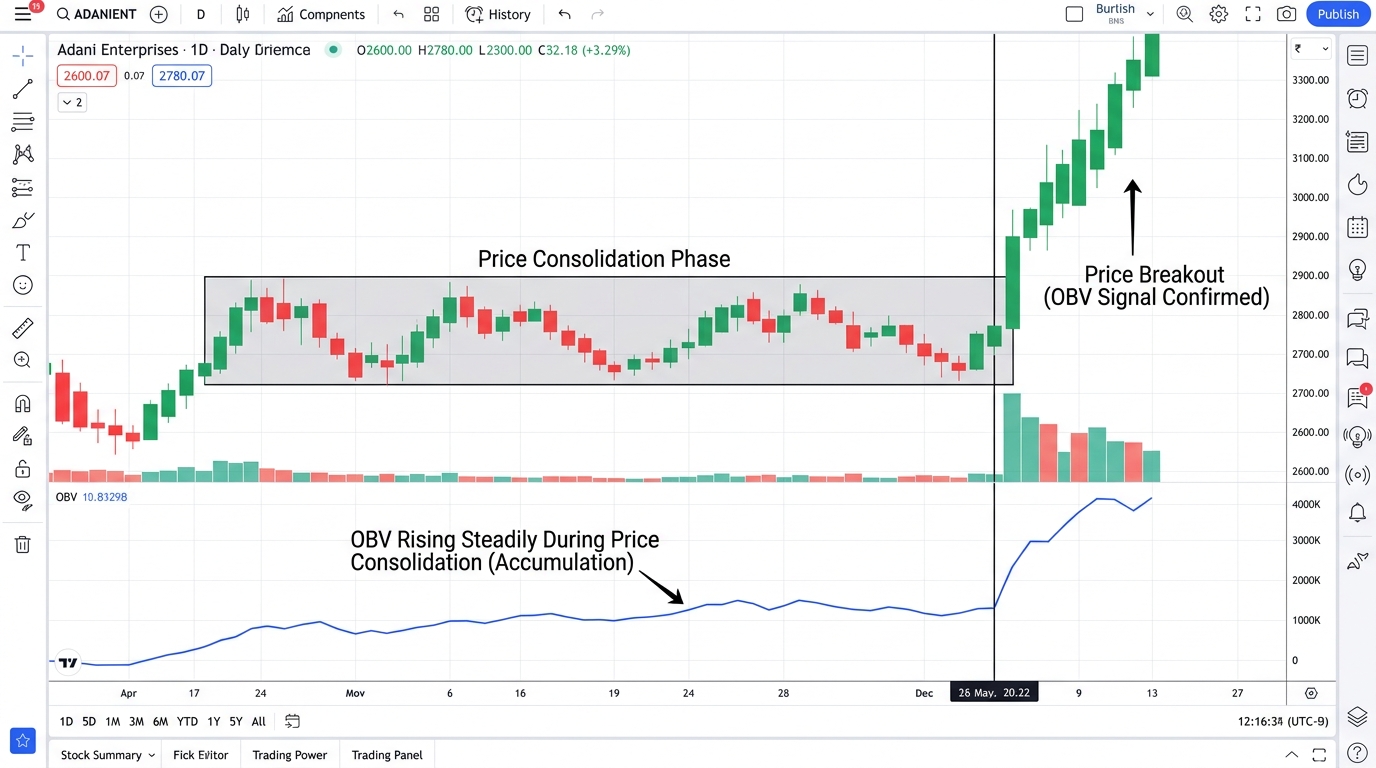
Strategy 2: OBV for Accumulation Detection
When a stock is in a sideways range but OBV is consistently rising, it signals quiet accumulation by informed players. This is a classic setup before a breakout — the stock appears boring but smart money is building positions. Screen for this on NSE 500 stocks using free tools like TradingView.
Strategy 3: FII/DII Volume Data
NSE publishes daily FII and DII buy/sell data. Combine this with OBV: when FII data shows net buying AND OBV is rising, it is a powerful confirmation of institutional interest in the broader market, making long setups in index-heavy stocks higher probability.
Volume Indicators Overview
| OBV | Cumulative volume direction — trend confirmation & divergence | |
| Volume SMA | Average volume line — helps identify unusually high/low volume | |
| VWAP | Volume-Weighted Average Price — key intraday level for institutions | |
| MFI (Money Flow Index) | RSI-like indicator incorporating volume | |
| Chaikin Money Flow | Measures buying/selling pressure over a period | |
| VWAP for Indian Intraday: VWAP (Volume Weighted Average Price) is the most important intraday level for Indian traders. Price above VWAP = bullish bias for the day. Price below VWAP = bearish bias. Institutions use VWAP as a benchmark for their order execution. | ||
Common Mistakes to Avoid
- Ignoring volume completely and only using price-based indicators — volume is the fuel of price moves.
- Not accounting for ex-dividend days or bonus share announcements, which artificially spike volume in Indian stocks.
- Ignoring the NSE’s ‘bulk deal’ and ‘block deal’ data — large single-session institutional transactions that are separate from normal volume but indicate conviction.
Summary
| Key Takeaway: Volume is the single most honest indicator in the market. Use it to confirm price moves, detect OBV divergences for early reversal signals, and identify institutional accumulation and distribution patterns in Indian stocks and indices. |
Responses