
Supertrend Indicator: A Complete Guide for Indian Stock Market Traders
What is the Supertrend Indicator?
The Supertrend is a trend-following indicator that plots directly on the price chart and gives clear buy and sell signals through color changes. It is particularly popular among Indian traders because of its simplicity and the clean visual signals it generates — making it one of the most-used indicators on Zerodha Kite, Upstox, and Groww.
Unlike RSI or MACD which are plotted in a separate panel below the chart, Supertrend appears directly on the candlestick chart, making signals immediately visible. A green line below price means buy (uptrend); a red line above price means sell (downtrend).
How Supertrend is Calculated
Supertrend uses two parameters: ATR Period and Multiplier.
| ATR Period | Number of periods used to calculate ATR (Average True Range) | |
| Multiplier | Controls how far the band is from price (higher = fewer signals, less whipsaws) | |
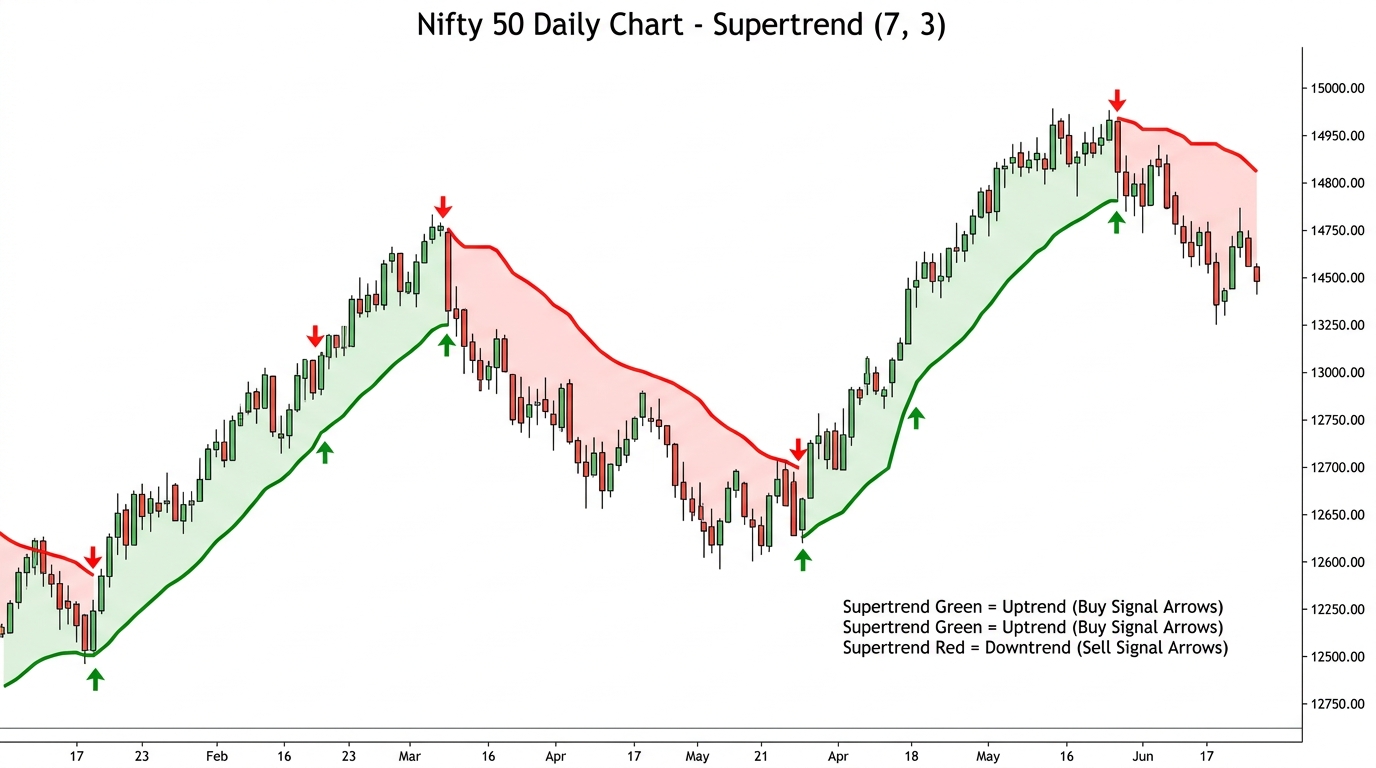
| Default Setting | Period 7, Multiplier 3 — most commonly used in India | |
| Upper Band | [(High + Low) / 2] + (Multiplier x ATR) — used in downtrend | |
| Lower Band | [(High + Low) / 2] – (Multiplier x ATR) — used in uptrend | |
| Key Mechanism: Supertrend switches from green (buy) to red (sell) when price closes below the lower band, and from red to green when price closes above the upper band. | ||
Reading Supertrend Signals
Buy Signal (Green Line Below Price)
When Supertrend turns green and appears below the price, it signals an uptrend. Traders should look for long (buy) opportunities and avoid shorting. The green line acts as a dynamic trailing stop-loss for long positions.
Sell Signal (Red Line Above Price)
When Supertrend turns red and appears above the price, it signals a downtrend. Traders should look for short (sell) opportunities and exit long positions. The red line acts as a trailing stop-loss for short positions.
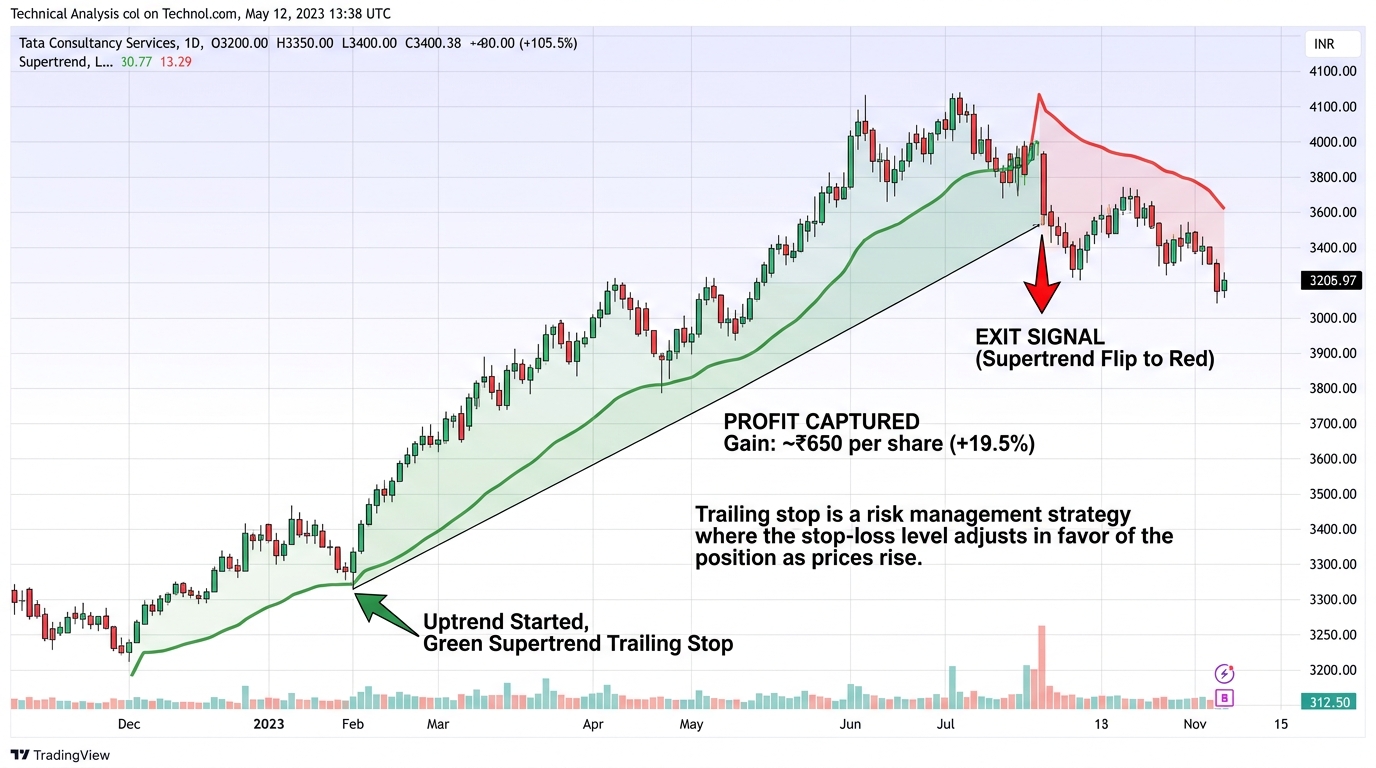
Using Supertrend as a Trailing Stop-Loss
This is one of the most powerful applications of Supertrend in Indian markets. Once in a long trade, place your stop-loss at the Supertrend value and trail it upward as the trend continues. The Supertrend will flip to red only when the trend genuinely reverses — often locking in significant profits.
Supertrend Settings for Different Styles
| Default (7, 3) | Daily charts — swing trading, most NSE large-caps |
| (10, 3) | Reduces whipsaws — better for volatile smallcaps |
| (7, 2) | More sensitive — intraday 15-min charts, F&O |
| (14, 3) | Slower signals — positional trading, weekly charts |
| (3, 1) | Very sensitive — scalping on 1-3 min charts only |
Supertrend Strategies for Indian Traders
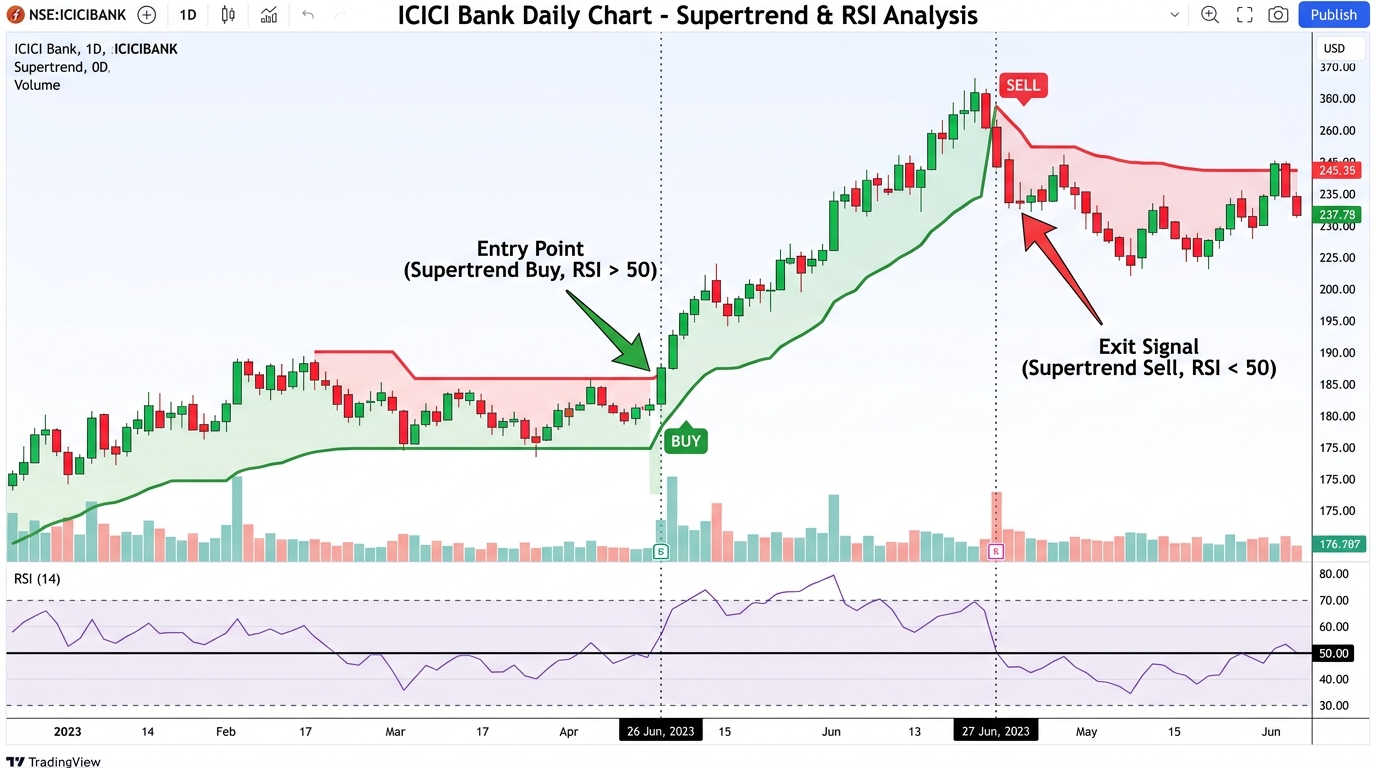
Strategy 1: Supertrend + RSI Confirmation
Buy when Supertrend turns green AND RSI is above 50. Sell or exit when Supertrend turns red AND RSI falls below 50. This combination dramatically reduces false signals in sideways markets and is widely used by Indian positional traders.
Strategy 2: Multi-Timeframe Supertrend
Check Supertrend on the daily chart first for trend direction. Then use the 1-hour chart Supertrend for timing the entry. This is a classic top-down analysis technique used by professional traders in India.
- Daily Supertrend green = only take long setups
- 1-hour Supertrend turns green while daily is green = high-probability long entry
- Exit when either timeframe turns red
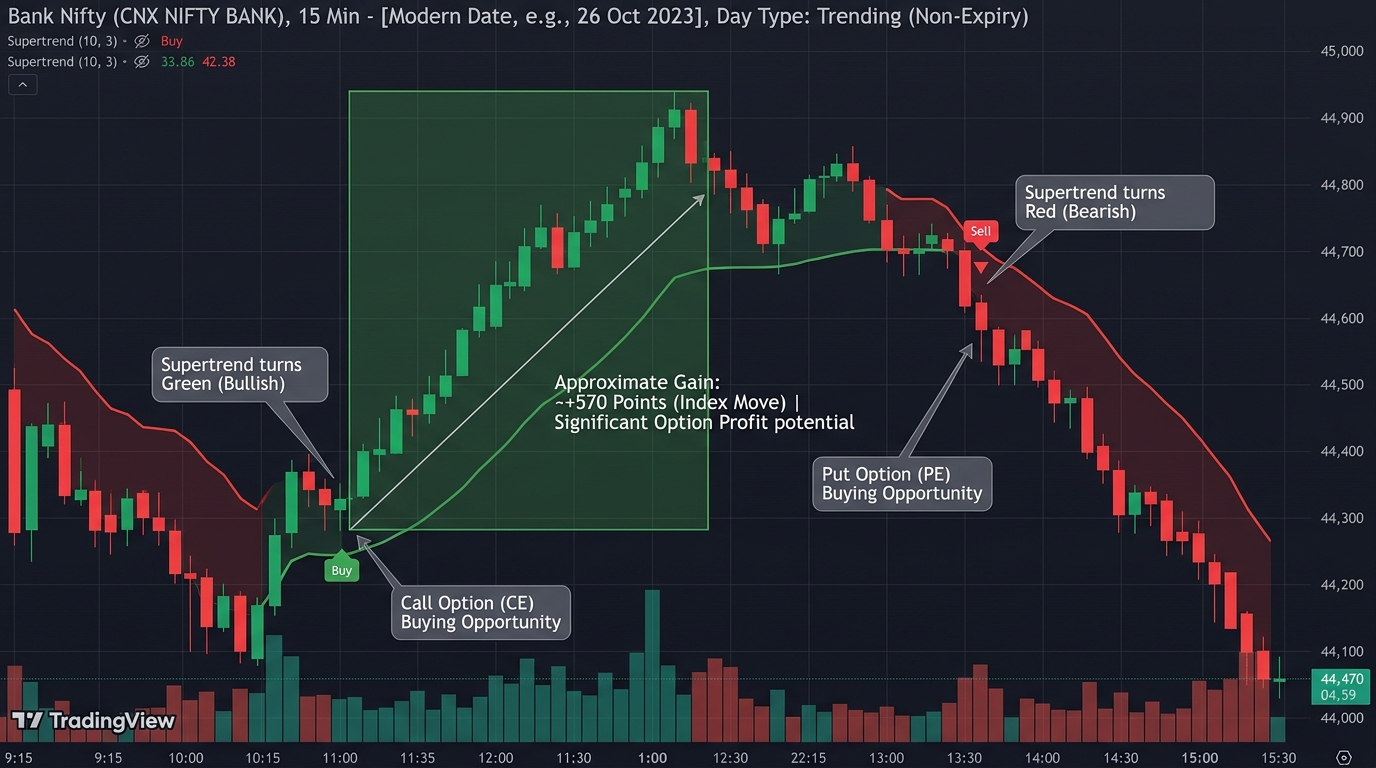
Strategy 3: Supertrend for Bank Nifty Intraday
On 15-minute Bank Nifty charts, Supertrend (7, 3) is one of the most-used systems among Indian options traders. Buy CE (Call options) when Supertrend turns green at the start of a trending day. Buy PE (Put options) when it turns red. Avoid using it on expiry days (Thursday for Bank Nifty) when volatility distorts ATR calculations.
Supertrend on NSE Screener
You can screen for stocks where Supertrend just turned bullish (green) across NSE using free tools like Chartink.com. A popular Indian trader setup is to scan for: Supertrend (7,3) buy signal on daily + price above 200 SMA + RSI above 50. This often surfaces strong momentum stocks early.
Common Mistakes to Avoid
- Using Supertrend in sideways, choppy markets — it whipsaws constantly when there is no trend. Always check if the market is trending before applying Supertrend.
- Trading every Supertrend flip without considering the broader trend on higher timeframes.
- Using very aggressive settings (low multiplier) which generate too many signals and increase brokerage costs — especially for Indian traders paying per-order charges.
- Ignoring the Supertrend signal on the day of RBI policy or major index rebalancing — these events cause temporary false flips.
Summary
| Key Takeaway: Supertrend is India’s most popular trend-following indicator for its simplicity and clear visual signals. Use it as a trailing stop-loss, combine it with RSI for confirmation, and apply multi-timeframe analysis for the best results on NSE stocks and indices. |
Responses