
Moving Averages — SMA & EMA: A Complete Guide for Indian Stock Market Traders
What are Moving Averages?
A Moving Average (MA) smooths out price data by creating a constantly updated average price over a specific period. It filters out the ‘noise’ of short-term price fluctuations, allowing traders to see the underlying trend clearly.
Moving averages are the backbone of technical analysis and are used by virtually every type of trader in India — from intraday scalpers on Bank Nifty options to long-term investors using weekly charts on the NSE 500.
SMA vs EMA — Key Differences
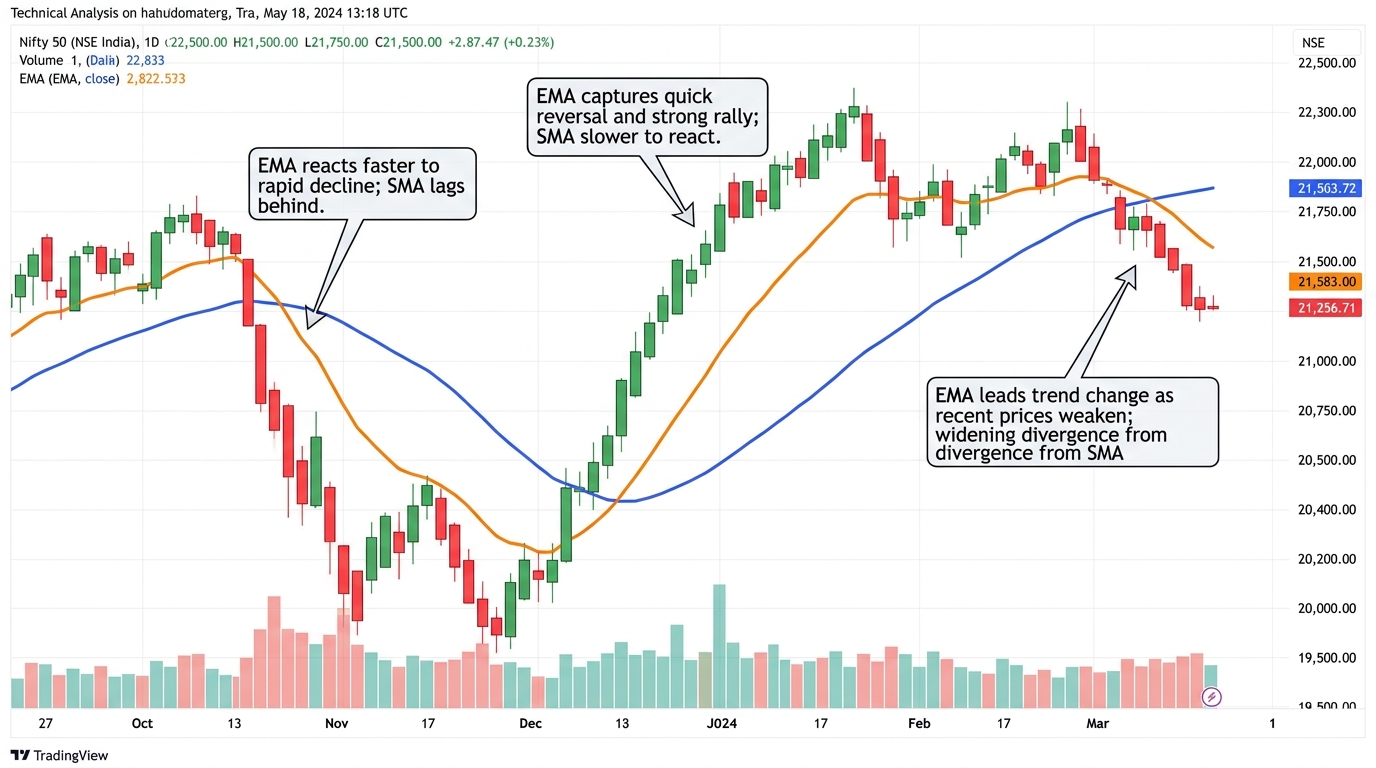
| SMA (Simple MA) | Equal weight to all periods — slower, smoother, less reactive | |
| EMA (Exponential MA) | More weight to recent prices — faster, more reactive to current price | |
| Best Use (SMA) | Support/resistance levels, long-term trend identification | |
| Best Use (EMA) | Entry/exit signals, trend following, short-term trading | |
| Which to Use?: Indian institutional traders (MFs, FIIs) frequently track the 200-day SMA on Nifty and large-caps. Active traders and algo systems prefer EMAs (20, 50) for faster signals. | ||
The Most Important Moving Average Levels in Indian Markets
| 20 EMA | Short-term trend — used by momentum and swing traders |
| 50 EMA / SMA | Medium-term trend — widely watched by fund managers |
| 100 SMA | Intermediate support/resistance on daily charts |
| 200 SMA / EMA | Long-term trend — THE most watched level in Indian markets |
| Weekly 20 EMA | Key level for positional traders and investors |
Key Moving Average Signals
1. Price vs Moving Average (Trend Filter)
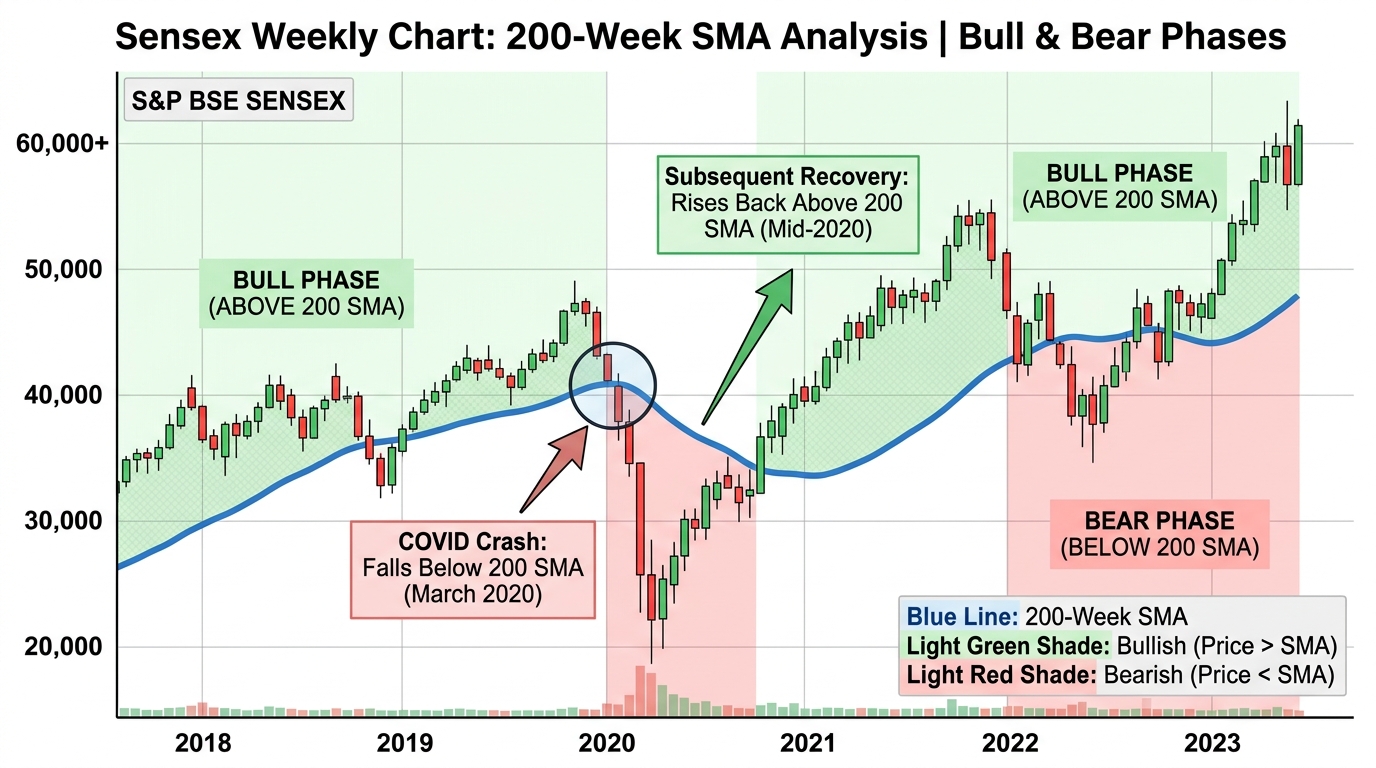
The simplest and most powerful use of MAs is as a trend filter. If a stock or index is trading above its 200-day SMA, it is in a long-term uptrend. Below the 200 SMA = long-term downtrend.
- Price above 200 SMA: Only consider buy setups — avoid shorting against the main trend
- Price below 200 SMA: Be cautious with longs — consider bearish setups
2. Moving Average Crossovers
When a shorter MA crosses above a longer MA, it signals a potential uptrend beginning. When it crosses below, a downtrend may be starting.
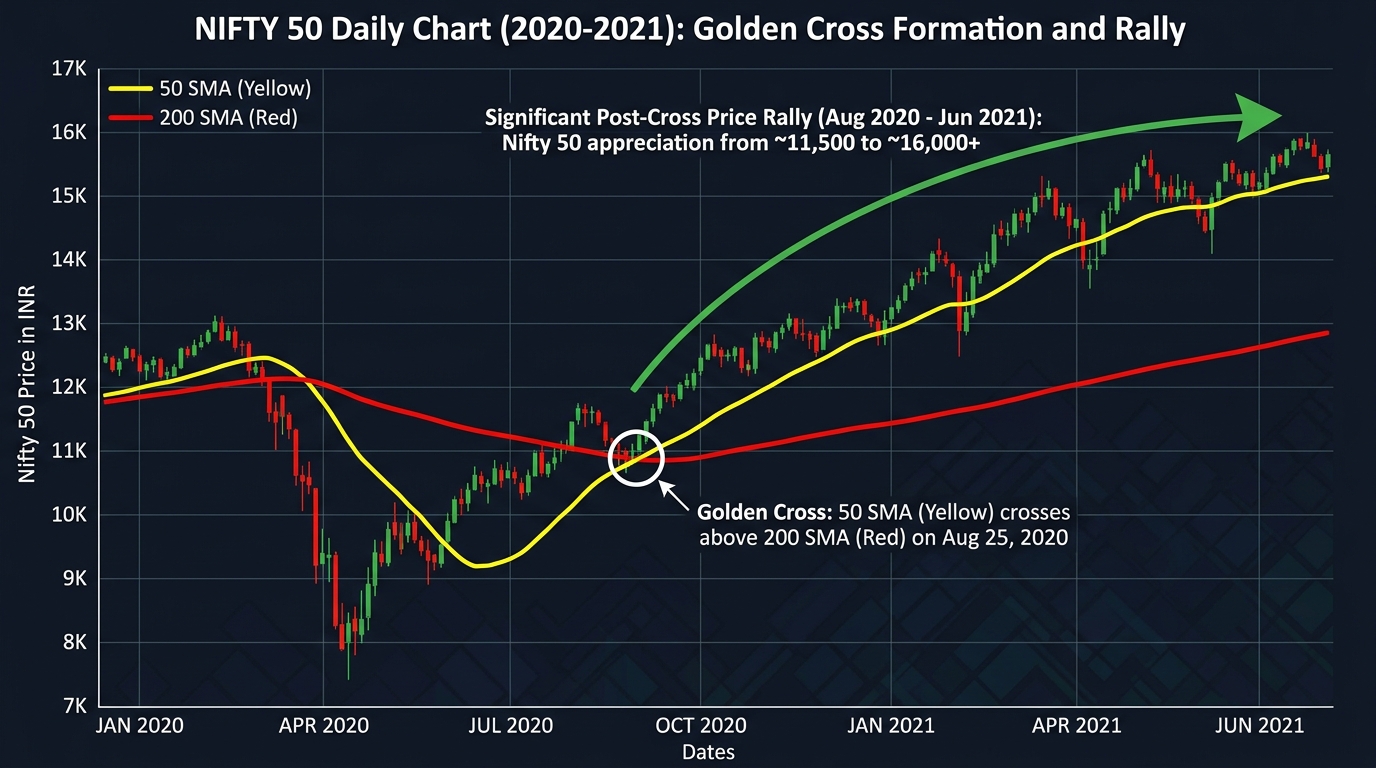
- Golden Cross: 50-day SMA crosses above 200-day SMA — major bullish signal. Seen on Nifty in mid-2020 after the COVID recovery.
- Death Cross: 50-day SMA crosses below 200-day SMA — major bearish signal. Seen on Nifty in early 2020 during the COVID crash.
3. MA as Dynamic Support & Resistance
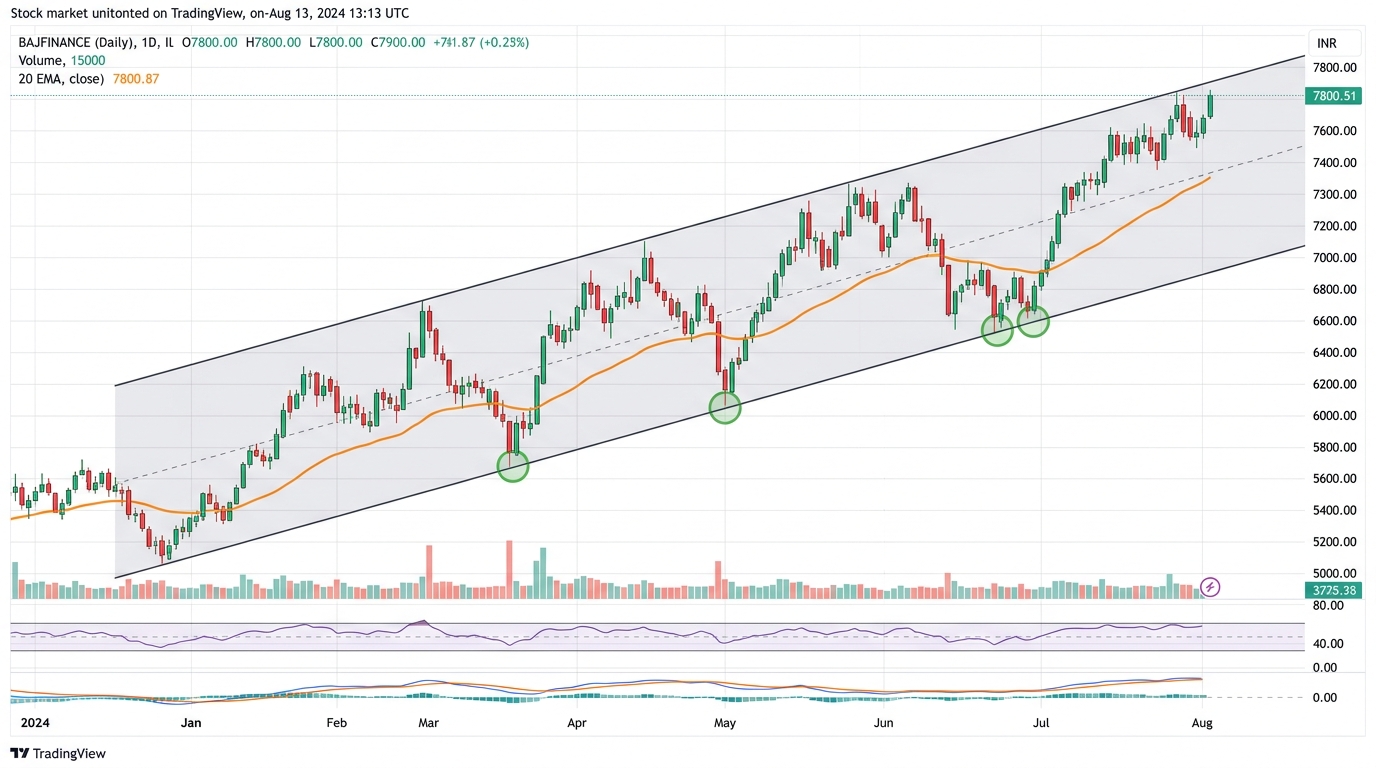
In trending markets, price frequently pulls back to a moving average and finds support before continuing in the trend direction. This is one of the most reliable setups for Indian swing traders.
- In an uptrend: 20 EMA and 50 EMA act as dynamic support — buy pullbacks to these levels
- In a downtrend: 20 EMA and 50 EMA act as dynamic resistance — sell rallies to these levels
4. Multiple Moving Average Systems
Using multiple MAs together creates a comprehensive picture of trend structure — short-term, medium-term, and long-term simultaneously.
| 20-50-200 System: If the 20 EMA is above 50 EMA, which is above 200 SMA, the stock is in a strong multi-timeframe uptrend — the safest environment to be a buyer. When all three align to the downside, stay away or only short. |
Moving Average Strategies for Indian Markets
Strategy 1: EMA Ribbon for Nifty Intraday
Plot 9, 21, and 55 EMAs on a 15-minute Bank Nifty chart. When all three are aligned upward and price is above all three, only take long entries. When aligned downward, only take shorts. This system works particularly well during trending days (non-expiry sessions).
Strategy 2: Weekly 20 EMA Pullback
One of the highest-probability strategies in Indian markets: on the weekly chart of Nifty 50, buy pullbacks to the 20-week EMA in an established uptrend. This level has acted as strong support in 2019, 2021, and 2023.
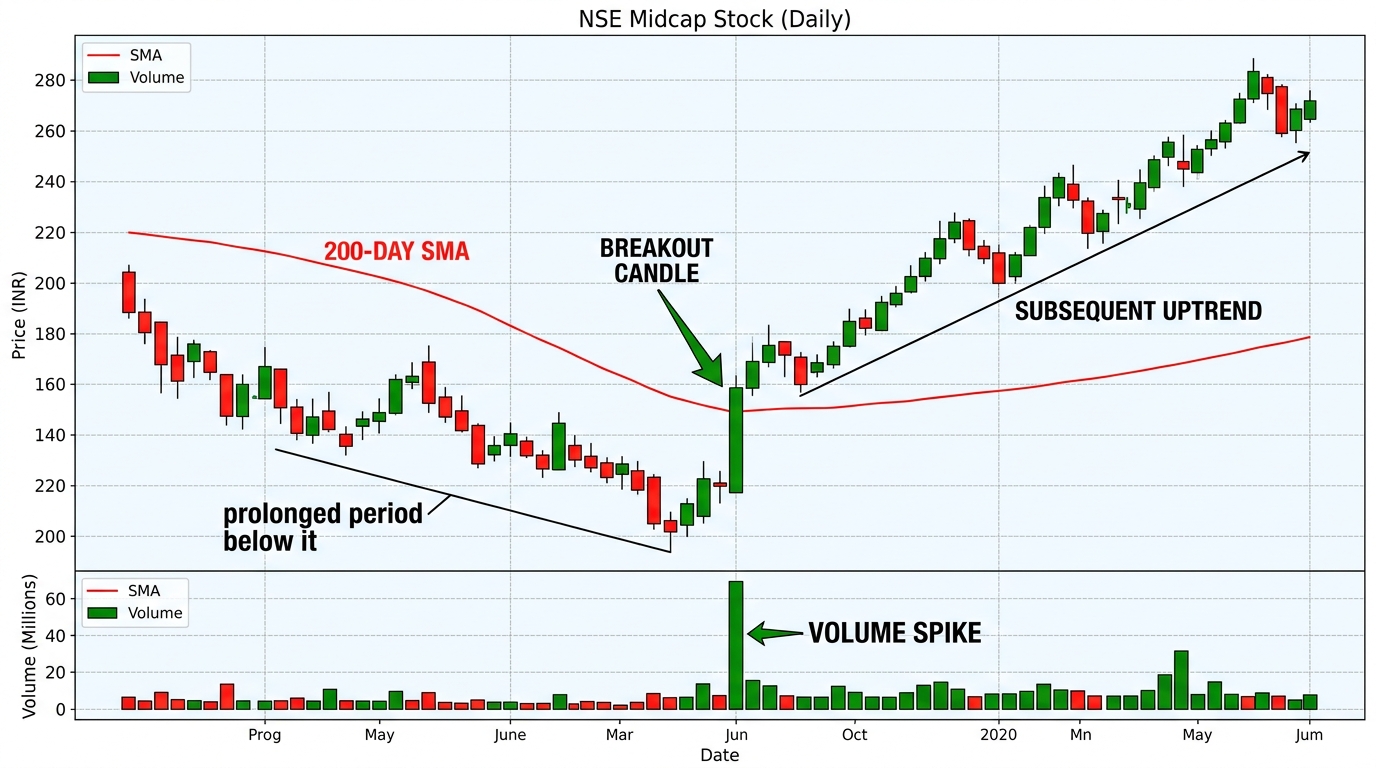
Strategy 3: 200 SMA Breakout
When a stock that has been below its 200-day SMA for months finally closes above it with strong volume — this is often the start of a major uptrend. Indian retail and institutional investors both watch this level, creating a self-fulfilling momentum effect.
Common Mistakes to Avoid
- Treating MA crossovers as buy/sell signals in ranging, sideways markets — they generate constant false signals when there is no trend.
- Using the same MA period for all stocks regardless of their volatility. High-beta stocks like Adani group may need shorter MAs; low-volatility FMCG stocks suit longer MAs.
- Ignoring the weekly and monthly MA picture when making daily chart trades.
Summary
| Key Takeaway: Moving averages define trend direction, provide dynamic support/resistance levels, and generate entry/exit signals through crossovers. The 200-day SMA is the single most important level in Indian markets for determining the overall market trend. |
Responses