
RSI — Relative Strength Index: A Complete Guide for Indian Stock Market Traders
What is RSI?
The Relative Strength Index (RSI) is one of the most widely used momentum oscillators in technical analysis. Developed by J. Welles Wilder Jr. in 1978, it measures the speed and magnitude of a security’s recent price changes to evaluate whether it is overbought or oversold.
For Indian traders using platforms like Zerodha Kite, Upstox, or Angel One, RSI is available on every charting tool by default — making it an essential starting point for both beginners and professionals.
How RSI is Calculated
RSI is plotted on a scale of 0 to 100. The standard formula is:
| Formula: RSI = 100 – [100 / (1 + RS)] where RS = Average Gain / Average Loss over N periods |
The default period is 14 (meaning the last 14 candles — days, hours, or minutes depending on your timeframe). A 14-day RSI is the most commonly used setting in Indian equity markets.
Reading RSI: The Key Levels
| RSI > 70 | Overbought — price may be due for a correction or pullback |
| RSI < 30 | Oversold — price may be due for a bounce or reversal |
| RSI = 50 | Neutral midpoint — often acts as support/resistance |
| RSI 40–60 | Ranging/sideways market zone |
| RSI > 80 | Strongly overbought (extreme momentum in bull trends) |
| RSI < 20 | Strongly oversold (extreme selling, possible panic bottom) |
How to Use RSI in the Indian Market
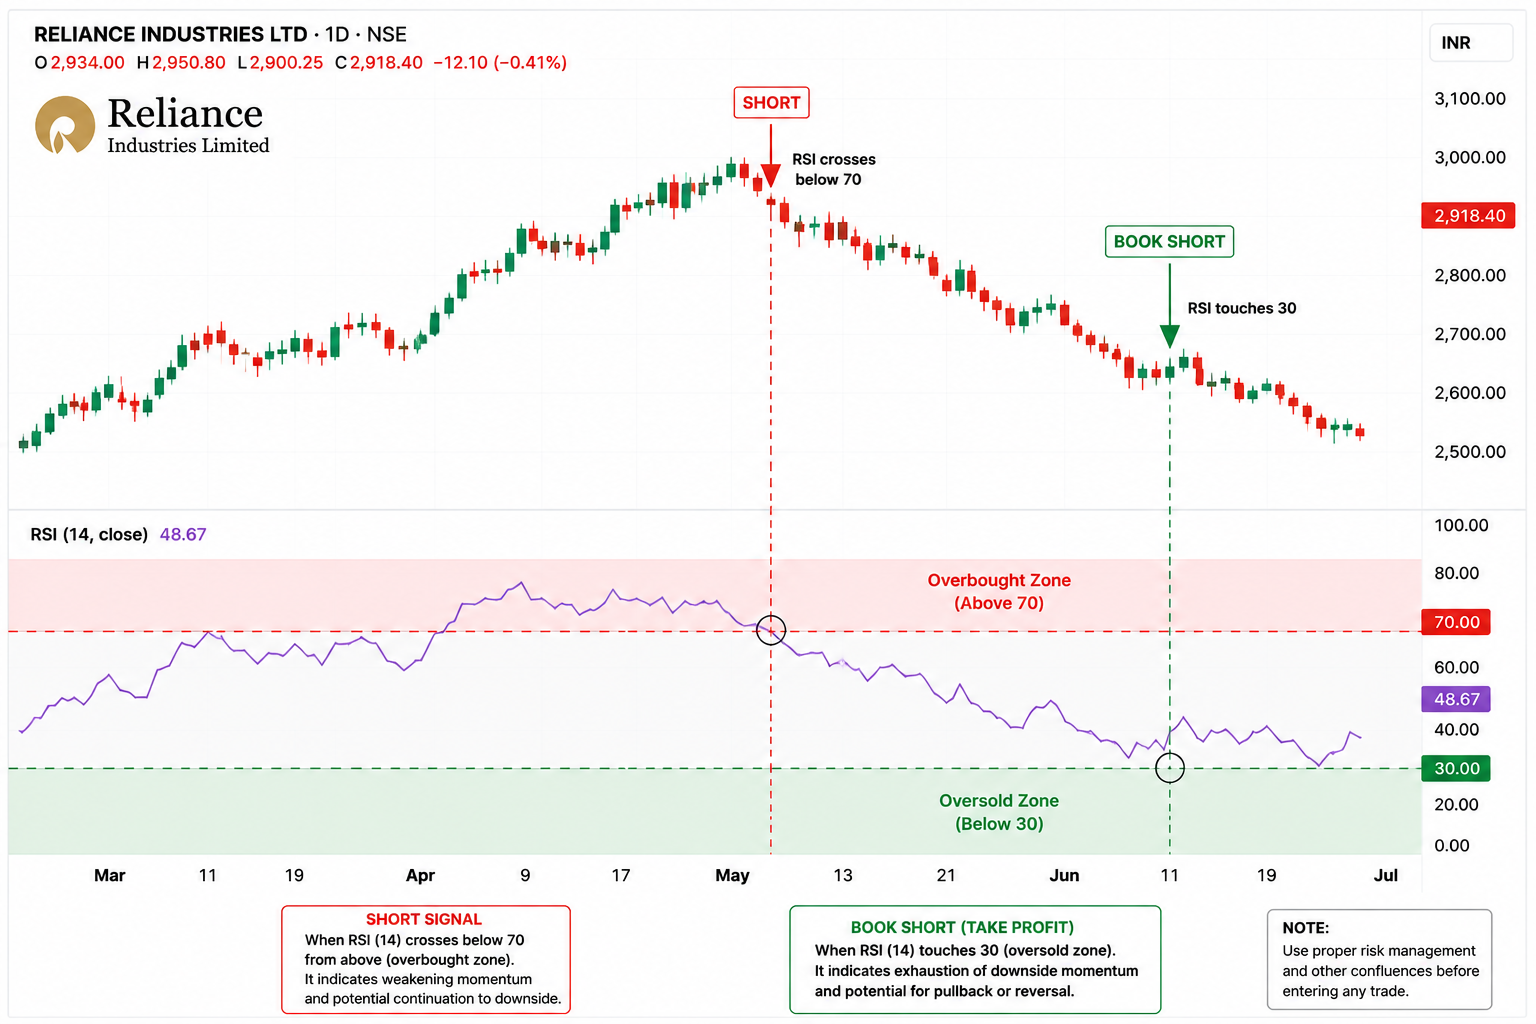
1. Overbought & Oversold Signals
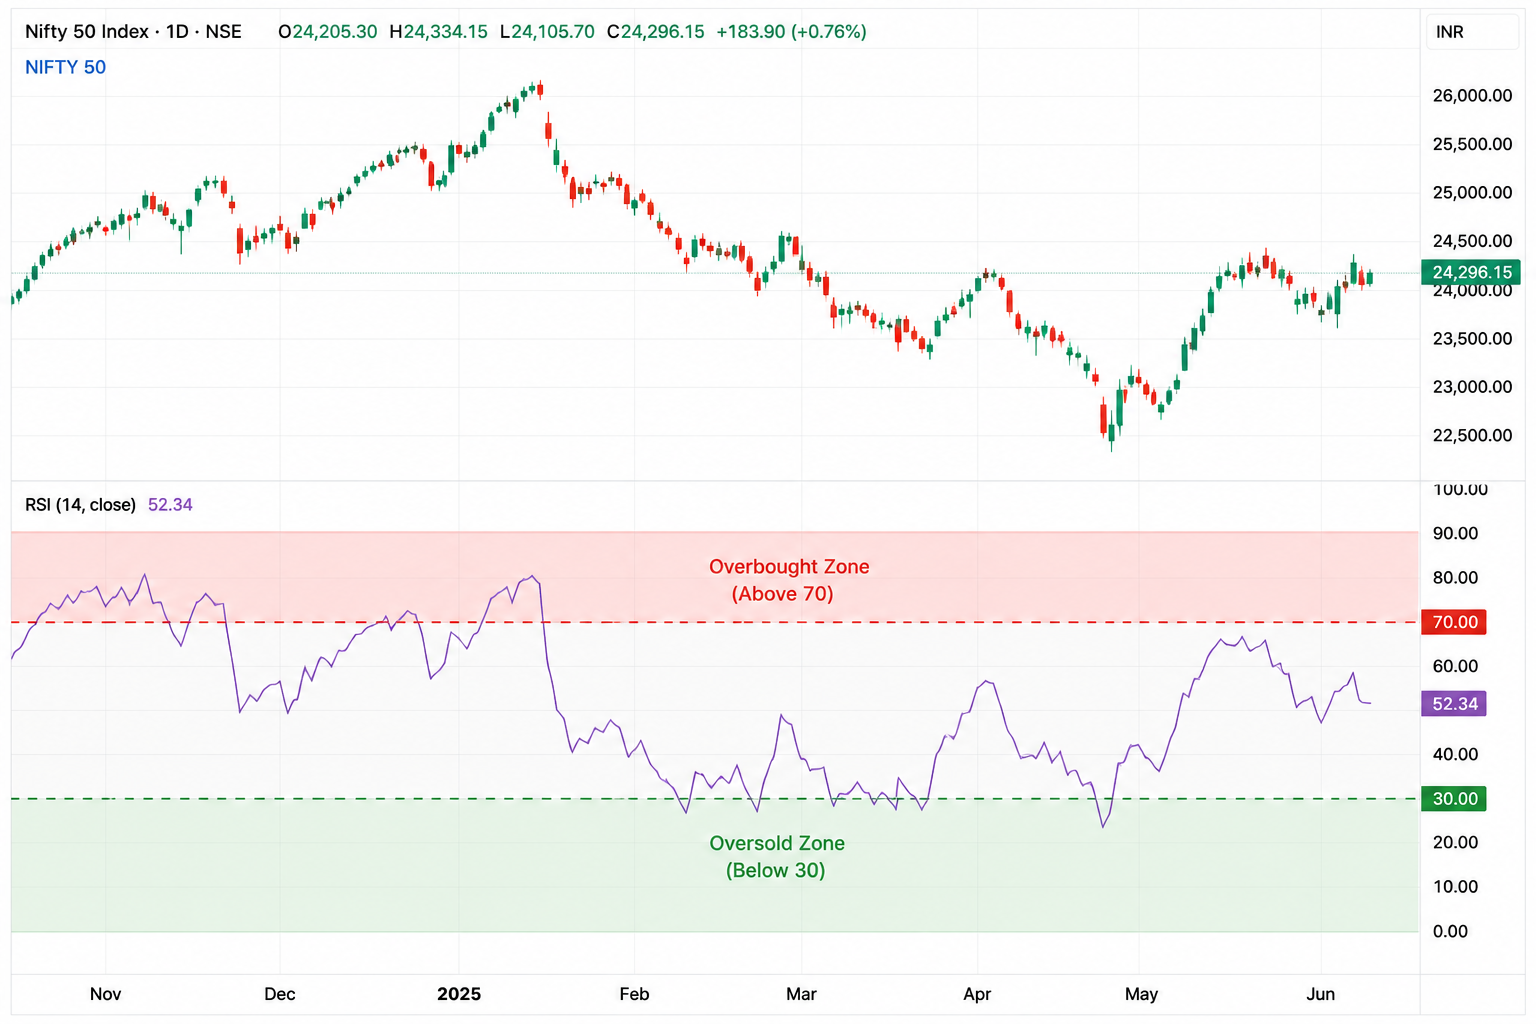
When Nifty 50 or a stock like Reliance Industries crosses above RSI 70, it signals that buyers have pushed the price too far, too fast. A move back below 70 can be a sell or exit signal. Conversely, when RSI drops below 30 on a fundamentally strong stock like HDFC Bank, it can represent a buying opportunity.
| India Context: During broad market rallies like Budget Day or RBI policy announcements, RSI on Nifty can stay above 70 for extended periods. Don’t blindly sell — always confirm with price action. |
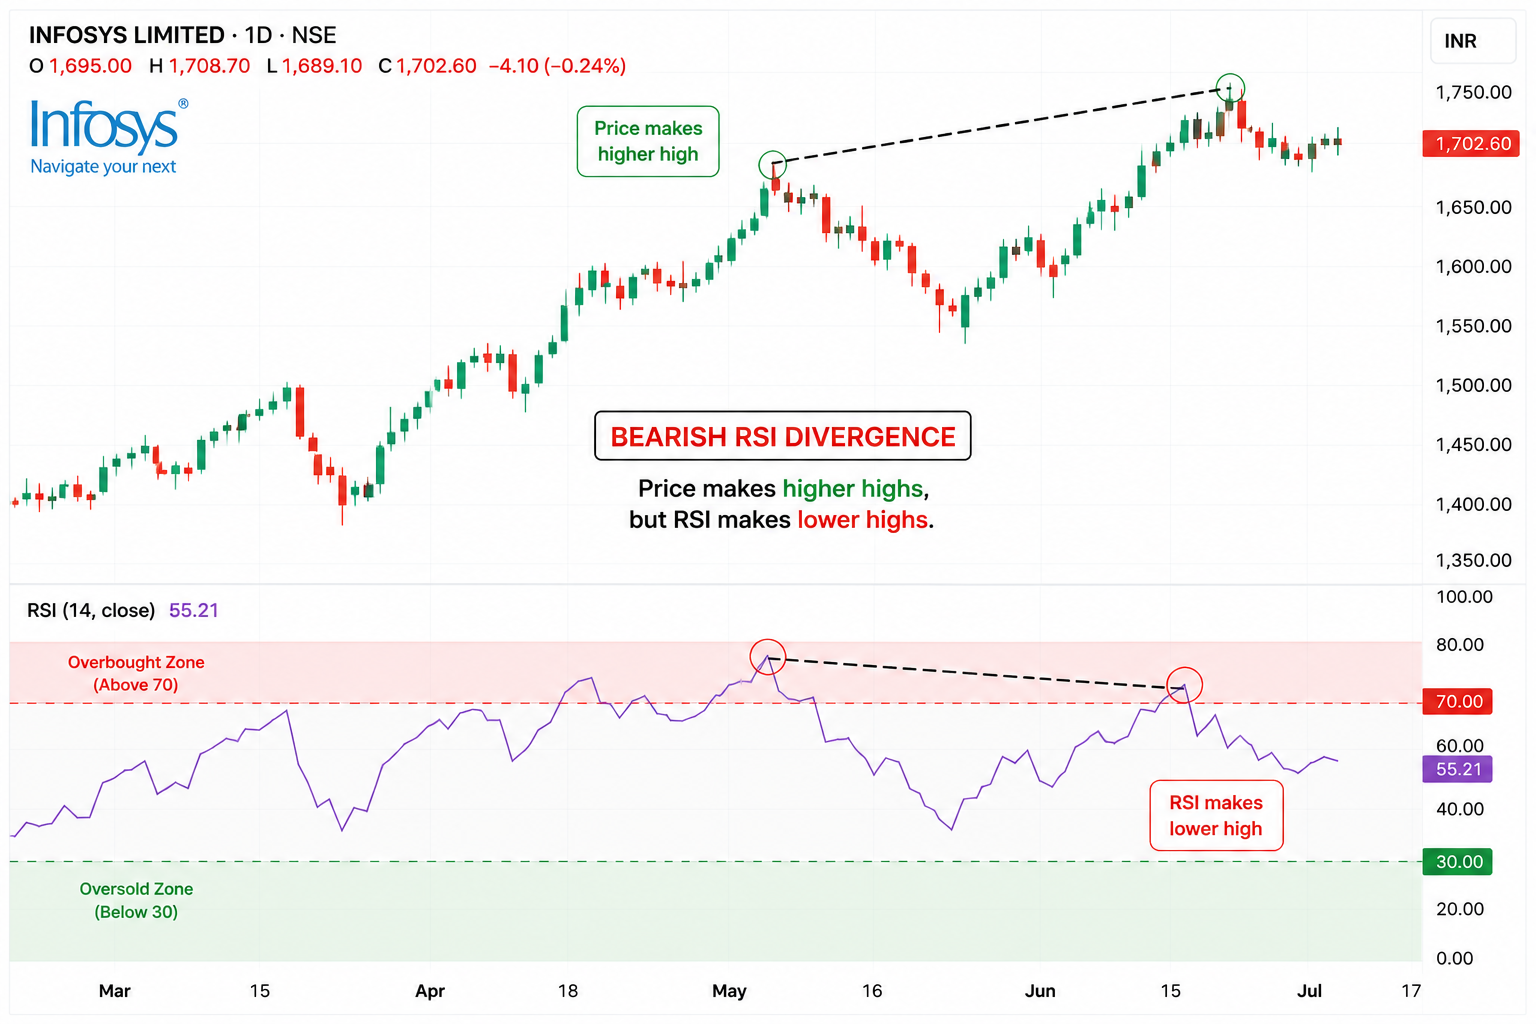
2. RSI Divergence
Divergence is one of RSI’s most powerful signals. It occurs when the price and RSI move in opposite directions.
- Bullish Divergence: Price makes a lower low, but RSI makes a higher low. This suggests selling momentum is weakening — often seen at bottoms in quality stocks.
- Bearish Divergence: Price makes a higher high, but RSI makes a lower high. This warns that buying momentum is fading — common near tops.
3. RSI Failure Swings
A failure swing is a strong reversal signal that doesn’t rely on price action — it’s based entirely on RSI behavior.
- Bearish Failure Swing: RSI rises above 70, pulls back, fails to reach 70 again, then breaks below the pullback low.
- Bullish Failure Swing: RSI drops below 30, bounces, fails to re-enter 30, then breaks above the bounce high.
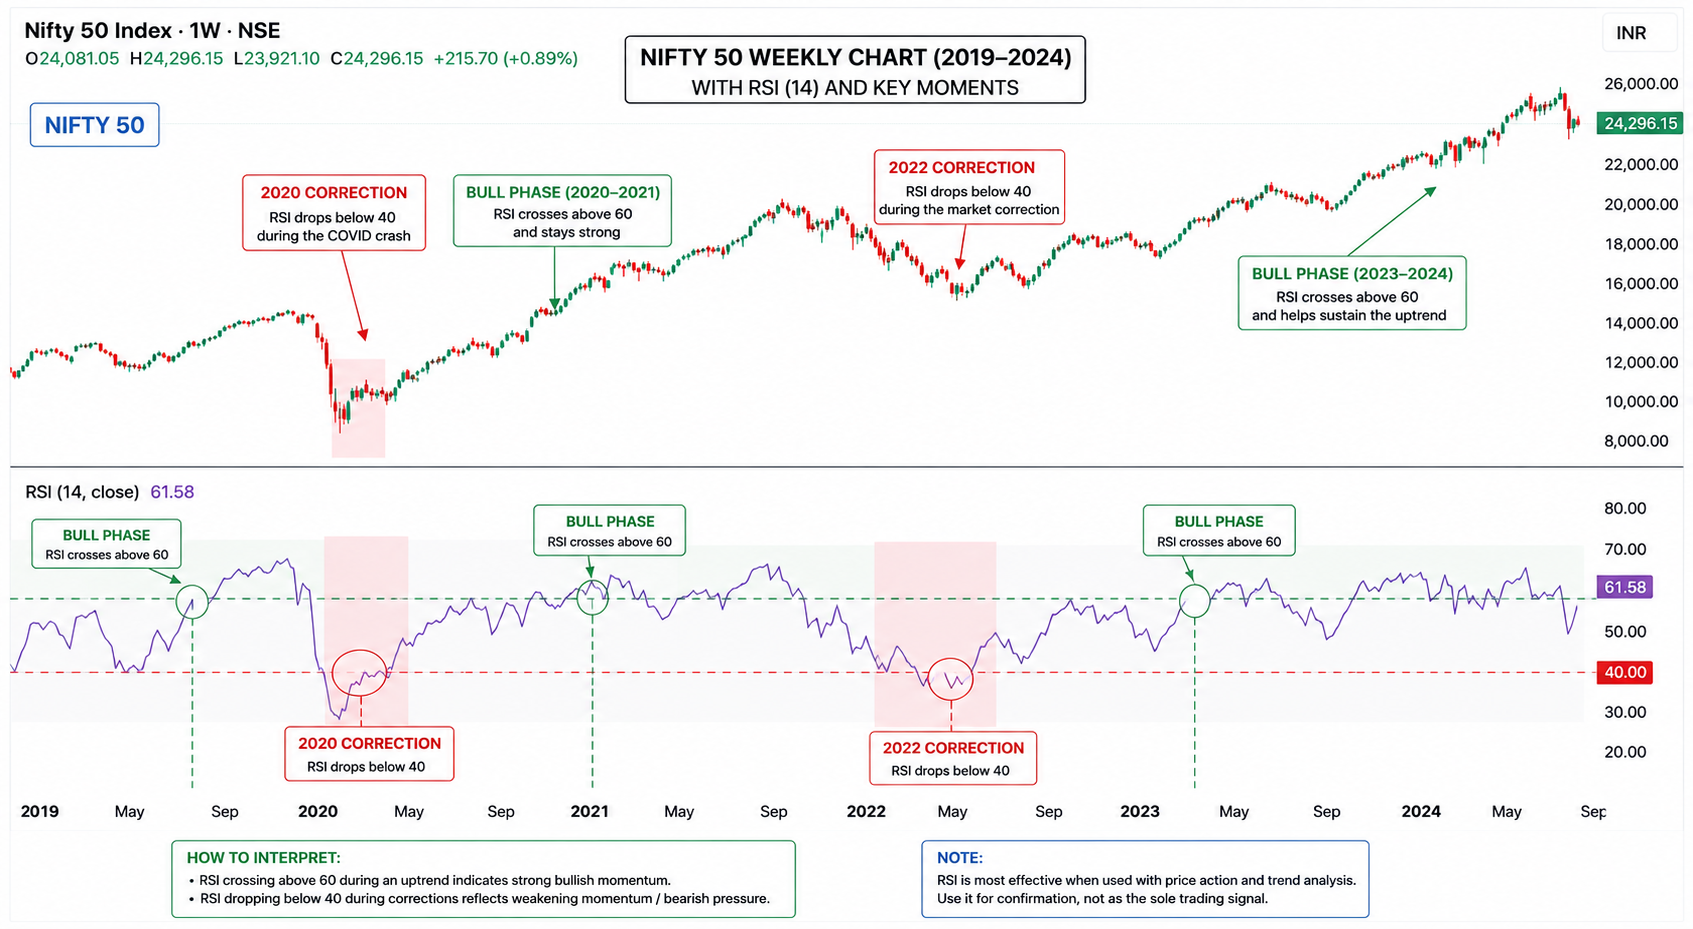
4. RSI as Trend Confirmation
During a strong uptrend (like Nifty’s post-COVID recovery 2020–2021), RSI tends to stay in the 40–80 range, with pullbacks holding above 40. In a downtrend, RSI stays in the 20–60 range, with bounces failing near 60.
| Pro Tip: Combine RSI with a 200-day EMA. If price is above the 200 EMA and RSI dips to 40–50, it is often a high-quality buying opportunity in momentum stocks on NSE. |
RSI Settings for Different Trading Styles
| Intraday (5–15 min) | RSI 9 or 14 — faster response, more signals |
| Swing Trading (Daily) | RSI 14 — standard, balanced |
| Positional / Long-term | RSI 21 or 28 — smoother, fewer false signals |
| Options Expiry (Weekly) | RSI 5–7 on 15-min for quick momentum reads |
Common Mistakes to Avoid
- Treating RSI > 70 as an automatic sell in a bull market — overbought can stay overbought.
- Ignoring the broader trend. RSI below 30 in a strong downtrend is not necessarily a buy signal.
- Using RSI alone without price action, volume, or other confirmation tools.
- Using the same RSI settings for all timeframes and all stocks regardless of volatility.
RSI on Indian Indices: Quick Reference
For Nifty 50, Bank Nifty, and Sensex, RSI 14 on daily and weekly charts is used by most institutional traders. Watch for RSI crossing 60 from below on the weekly Nifty chart — historically, this has aligned with the start of sustained bull phases in India.
Summary
| Key Takeaway: RSI is a momentum oscillator. Use it to identify overbought/oversold conditions, spot divergences, and confirm trends — but always use it in combination with price action and other indicators for best results in Indian markets. |
Responses